07 Administrative elements
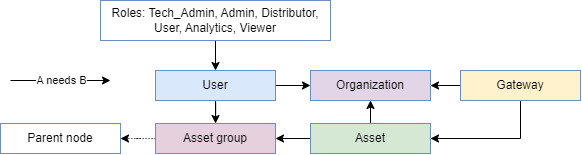
Management elements are users, organizations, asset groups, assets, gateways and asset categories. They are interrelated and in some cases mutually dependent. For example, the user (A) needs an organization (B) as well as a role and an asset group to be created (see figure below). Not all roles have access to all administrative elements, for example the asset category administration is only accessible for SUPERADMINs.
07.1 User administration
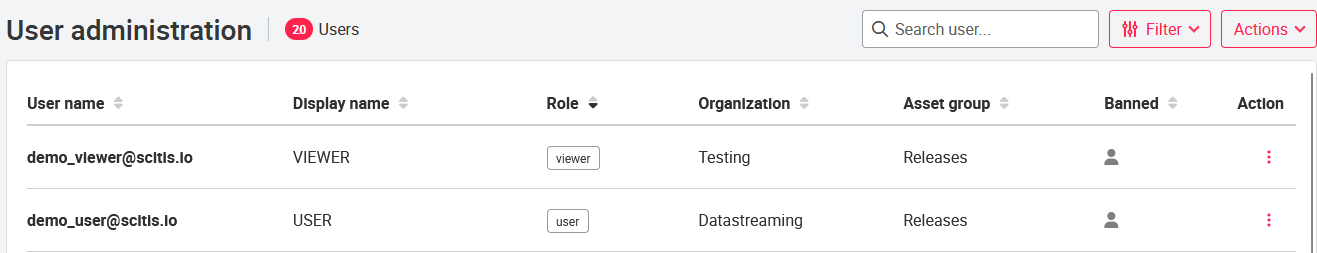
The Users page is located in the header of the portal in the dropdown of the profile name, under Settings, it redirects you to the User Management. There the admin can add (top right), edit and remove users (right under action ![]() ). Existing user passwords can be reset or locked/unlocked. Likewise, the terms of use for each individual user can be reset.
). Existing user passwords can be reset or locked/unlocked. Likewise, the terms of use for each individual user can be reset.
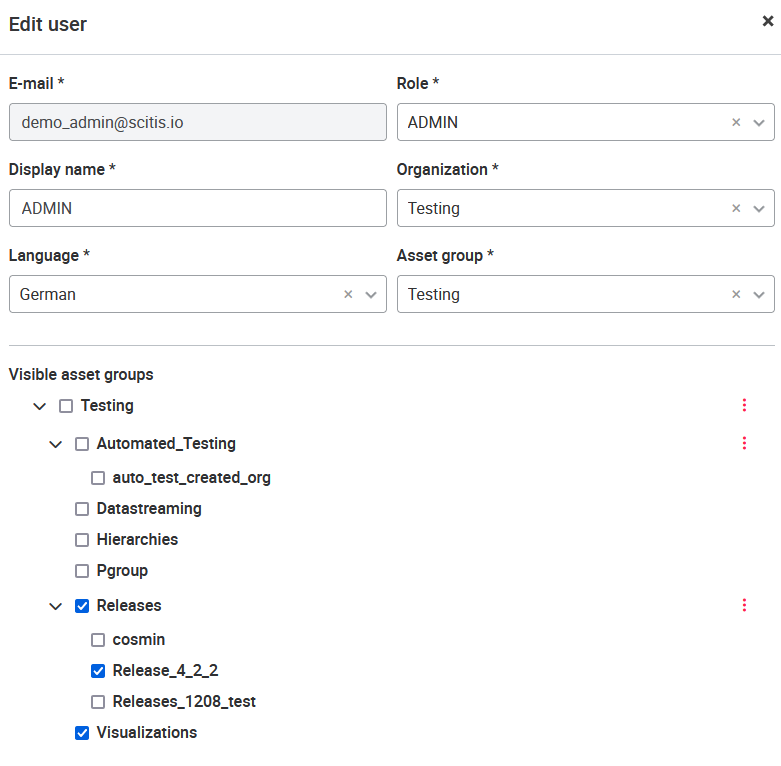
To add a new user, the administrator must enter six pieces of information. The user's e-mail address serves as the login name and the password is sent to this address. The display name is the name that appears in the portal header. The user has access to the selected asset group. The role determines which rights the user has. In addition, the user's language must be selected; the portal is displayed in this language immediately after login.
It is possible to assign multiple asset groups to a user. In order to do that a portal administrators (SUPERADMIN, ADMIN) can change the access privileges - assigning single/multiple, parallel asset groups, so that users have a more regulated and clean access to the groups relevant to them.
The settings cause the following adjustments:
- A user can be assigned to numerous parallel asset groups or a subset of a parallel asset group with the help of ‘Edit’ modal in User admin page.
- A scrollable window with the hierarchy of parallel / accessible groups in the user's organization's asset group can be seen.
- The user will have access to only the assets in their organization and the asset groups he/she is a member of.
- The user can access his defined asset groups on the admin pages and in the left menu.
The following table shows the existing user roles and their rights. (✓ = create / edit / delete, ![]() = visible,
= visible, ![]() = not accessible)
= not accessible)
| Authorization | VIEWER | USER | ANALYTICS | DISTRIBUTOR | ADMIN | Tech_ADMIN |
|---|---|---|---|---|---|---|
| Asset pages | ||||||
| Custom page mode ADMIN | ✓ only users of an organization and its suborganization | ✓ only users of an organization and its suborganization | ||||
| Custom page mode USER | ✓ | ✓ | ✓ | ✓ | ||
| Tableau Page | ✓ only assets of one organization and its suborganization | ✓ only assets of one organization and its suborganization | ||||
| Frame Page (BETA) | ✓ only asset groups of an organization and its suborganization | ✓ only asset groups of an organization and its suborganization | ||||
| External URL Page | ✓ only gateways of an organization and its suborganization | |||||
| Error page | ✓ | ✓ | ||||
| WebGL Content Page (BETA) | ✓ | |||||
| Bucket Browser | ✓ | |||||
| Formular Page | ✓ | |||||
| Interactive Datenanalysis (Edit colors/axes) | ✓ | |||||
| Node | ✓ | ✓ | ✓ | ✓ | ||
| Asset group pages | ||||||
| Tableau | ✓ | |||||
| Frame page | ✓ | |||||
| Externe URL page | ✓ | |||||
| REST-API Configuration | ||||||
| REST-API Konfiguration | ✓ | |||||
| Trigger Action Configuration | ||||||
| ✓ | ✓ Only for himself | ✓ | ✓ | ✓ | ✓ | |
| NOTIFICATION | ✓ | ✓ | ✓ | |||
| QUERY | ✓ | ✓ | ||||
| REFRESH | ✓ | ✓ | ||||
| PUBSUB | ✓ | |||||
| Trigger Configuration type | ||||||
| REAL_TIME_BASED | ✓ | ✓ | ||||
| TIME_BASED | ✓ | ✓ | ||||
| VALUE_BASED | ✓ | ✓ | ||||
| TRIGGER_BASED | ✓ | ✓ | ||||
| OFFLINE | ✓ | ✓ | ||||
| NO_DATA | ✓ | ✓ | ||||
| NEW_ROWS_-APPENDED | ✓ | ✓ | ||||
| API Configuration | ✓ | |||||
| User setting | ✓ | ✓ | ✓ | |||
| Organization setting | ✓ | ✓ | ||||
| Asset setting | ✓ | ✓ | ||||
| Asset group setting | ✓ | ✓ | ✓ | |||
| Gateway setting | ✓ |
07.2 Organization administration
The Organization page is located in the header of the portal in the profile name dropdown, under Settings. Users, assets and gateways can be added to an organization here. The organization can then manage the items depending on their hierarchical arrangement. (Top-down principle, the organization can manage only its subordinate elements but not its superordinate ones).
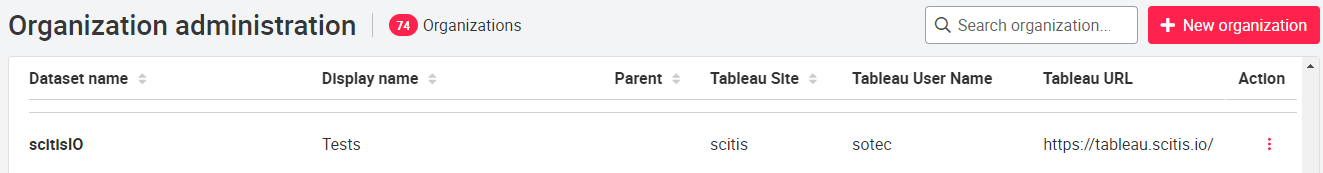
New organizations can be added using the 'New Organization' button in the upper right corner. In the column 'Action' existing organizations can be edited and removed. Additionally, the user agreements can be revoked. Furthermore, the Tableau configuration details can be entered here. This is required to later select and display Tableau views for an asset.
The authentication credentials are added in the modal for new / edit organizations. A radio button field is used to indicate whether Tableau Cloud or Server is used. If Tableau is configured, all fields need to be filled.
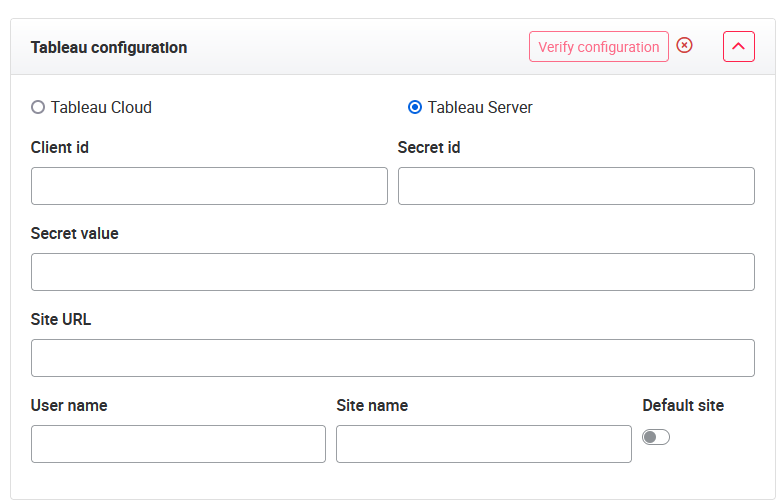
The following input fields are now available (in brackets the names on the tableau site are written):
- Site URL (Tableau URL)
- Site name (Tableau Site Name)
- User name (Tableau user)
- Client ID (Tableau Connected App Client ID)
- Secret ID (Tableau Connected App Secret ID
- Secret value (Tableau Connected App Secret Value)
The needed information can be found in the Tableau Cloud configuration settings in the tab ‘Connected Apps’. Please open the Tableau scitis integration and copy and paste the needed values from here into the configuration of our framework.
Note: For each organization, an asset group is automatically created and assigned to the organization.
Contacts and organization-specific constants can be created for each organization and displayed under My Account (see Header and Logout). To do this, click Configuration ![]() next to the corresponding organization name under Action. You will now be taken to the Organization Configuration page, which displays the organization's assets and users.
next to the corresponding organization name under Action. You will now be taken to the Organization Configuration page, which displays the organization's assets and users.
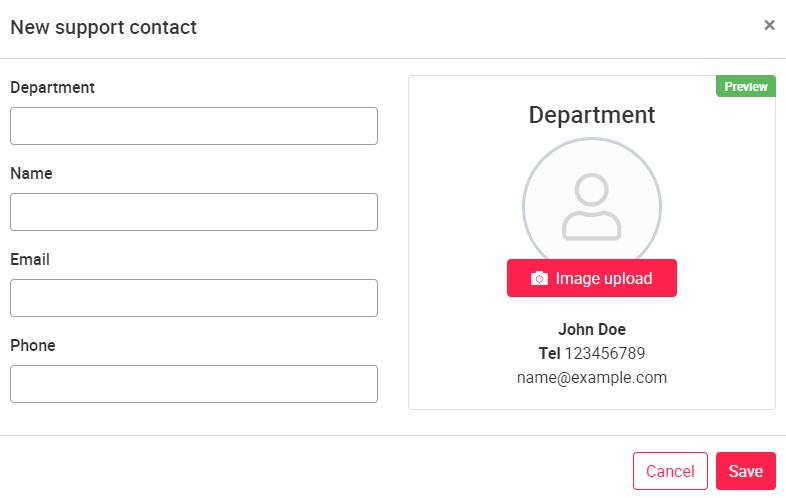
Under Contact Person, a new contact person can be created by clicking New Contact Person in the upper right corner. The Department, Name, Email and Phone fields must be filled in. Optionally, a picture can be added for the support. 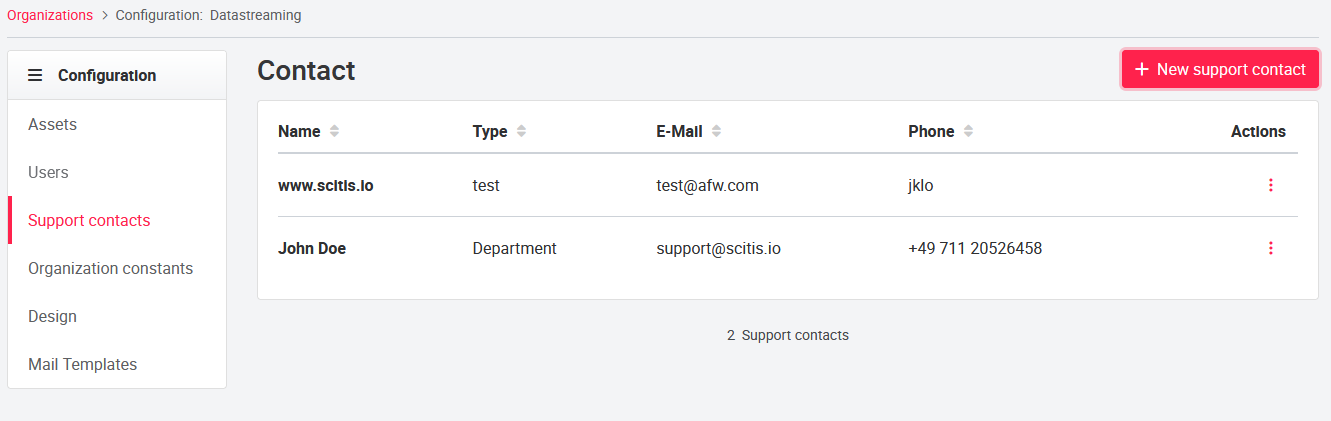
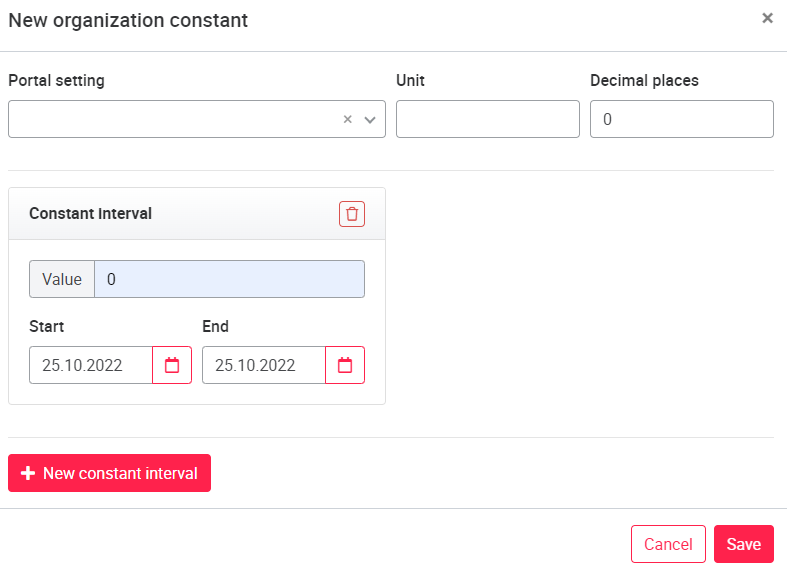
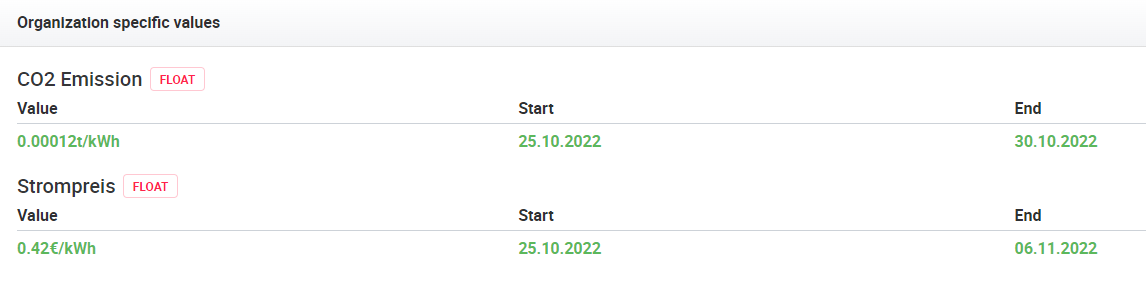
Under Organizational Constant, an organization-specific constant can be created via New Organizational Constant in the upper right corner. Under Portal Settings you will find values created by your portal operator that you can use. The unit and decimal places can be specified optionally. Via the button + New constant interval you can add a new constant. Now you can enter a value (number separation by dot "."), as well as start and end time for the validity of the value. Organization constants can be offset with other data signals in the data configuration (see Data configura) and output on the tile.
The administrator can select suitable settings and create constants that are displayed to the user under My account. If you would like to set up a new type of organization constant in the portal, please contact the portal operator. This can create the constant in the portal accordingly.
07.2.1 Organization design
For each sub-organization of the portal operator, logos and colors for the portal can be selected on the Design page in the organization configuration. A total of three logos and seven colors can be can be changed.
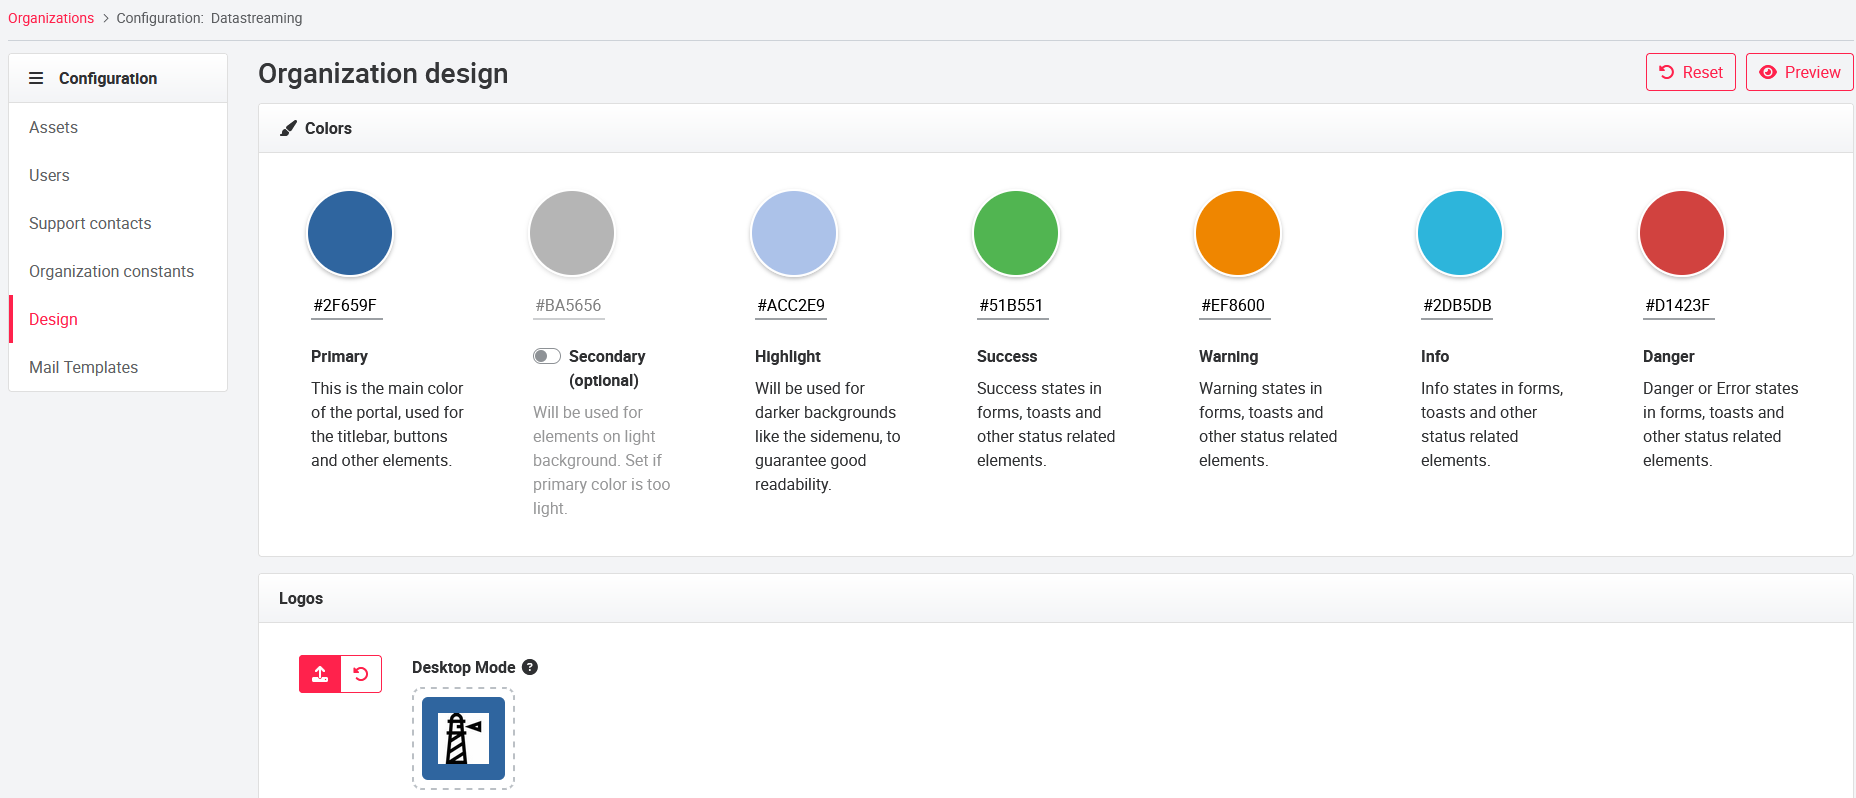
Color adjustment: To adjust a color, click on the corresponding color, the color palette will open. You can define the color using the color scale, RGB, HSL or a hexadecimal color code.
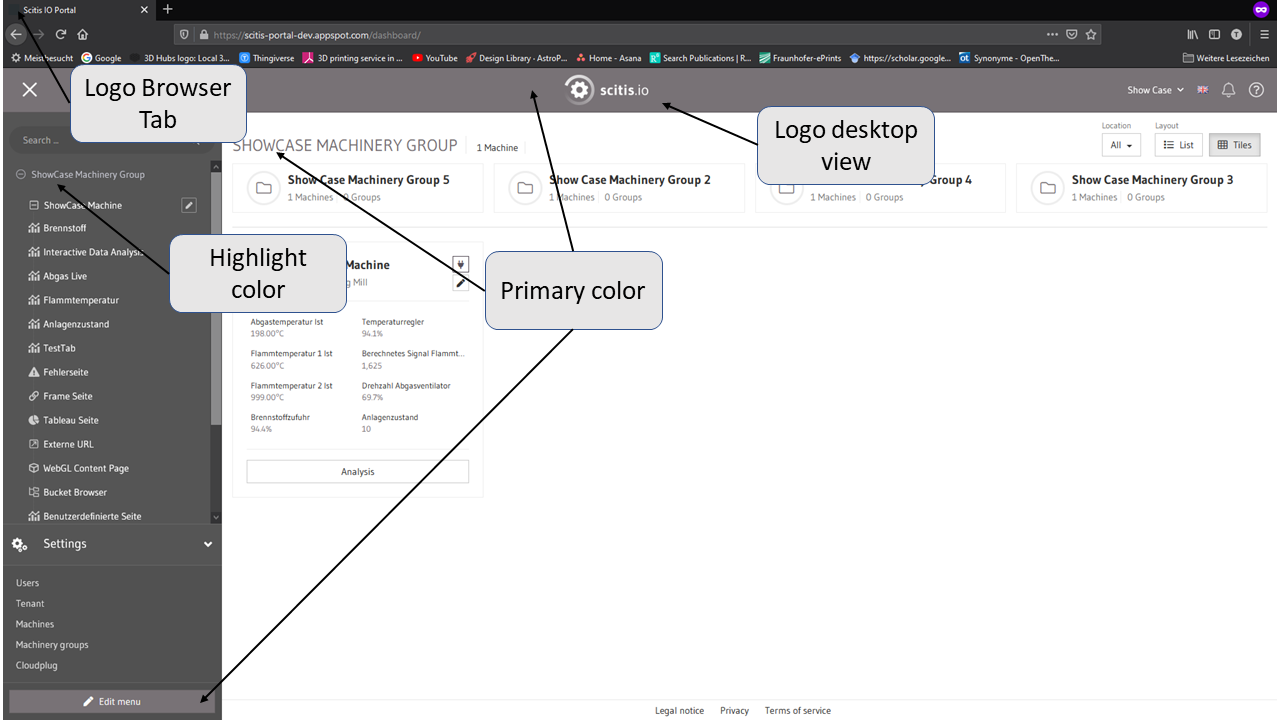
The Primary color determines the colors of the header as well as the buttons. The Highlight color is applied to all fonts and areas (unless secondary color is enabled) that are highlighted during a selection (e.g. pages within an asset, points for drag & drop, ...). Info, Warning, Error and Success affect the colors of the status messages that appear in the upper right corner.
The Secondary color adjusts the font color e.g. on tiles and text diagrams. This function can be activated if the font is not easily readable due to a light primary color.
Customize Logo: To upload a logo, click on the logo or upload button. The logos for the portal in desktop and mobile view can be uploaded in .PNG format and with the dimensions of ideall 200 x 51 pixels and 100 x 100 pixels respectively. The image size will be automatically adjusted if it is not correct. The browser tab logo will appear next to the browser tab text. This image must be uploaded in .ICO format, ideally with the dimension 32 x 32 pixels. Clicking on the question marks to the right of the image names will display the required properties for the images.
The Desktop View logo is displayed in the header when the platform is displayed on a large screen. The Mobile view logo is for viewing on small screens (e.g. smartphone,tablet, ...).
To apply all changes, click Save. Save applies the changes to all sub-organizations. If organizations edit their own design configuration, they will need to reload the page..
Inheritance of Settings: All design customizations made by an organization will be propagated to all its sub-organizations. Should one of the sub-organizations wish to have its own design, this is of course also possible. For this, the design of the corresponding sub-organization must be adapted. In this case, the design of the sub-organization is used and not that of the parent organization.
07.2.2 Mail Templates
The mail templates offer the possibility to create individual e-mails for the welcome e-mail to new users and the reset/change password e-mail. From the portal settings that are Setting up the portal, a default text is already stored. All ADMIN user roles can insert and format the text using the HTML code and use the placeholders. The placeholders insert an appropriate text in the place of the placeholder (e.g. username - %userName% - or URL of the portal - %portalUrl). It is not possible to insert images.
Use the Preview button to get a preview of the text. To save the text, click Save.
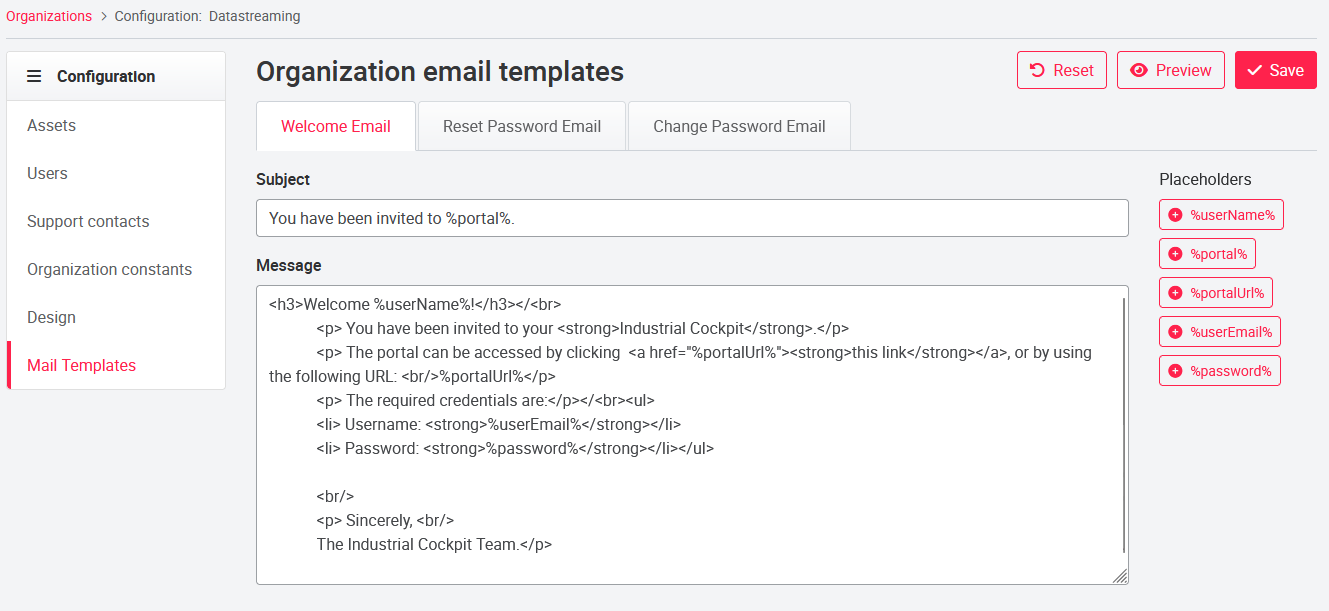
Clicking the Reset button located next to Preview and Save will delete all user input and reset the text to the default text. The reset always refers to the currently selected e-mail template. If the size of the text box is not sufficient, the icon in the lower right corner of the text box can be used to make the window larger.
07.3 Asset administration
The aseet administration page is located in the header of the portal in the profile name dropdown, under Settings. It is the asset management of the portal. Here the assets are added, edited and managed. There are four possible actions per asset: remove asset ![]() , list gateways
, list gateways ![]() (shows the list of connected gateways), Edit asset
(shows the list of connected gateways), Edit asset ![]() and Configuration
and Configuration ![]() (The action buttons are located on the right in the Action column
(The action buttons are located on the right in the Action column ![]() ).
).
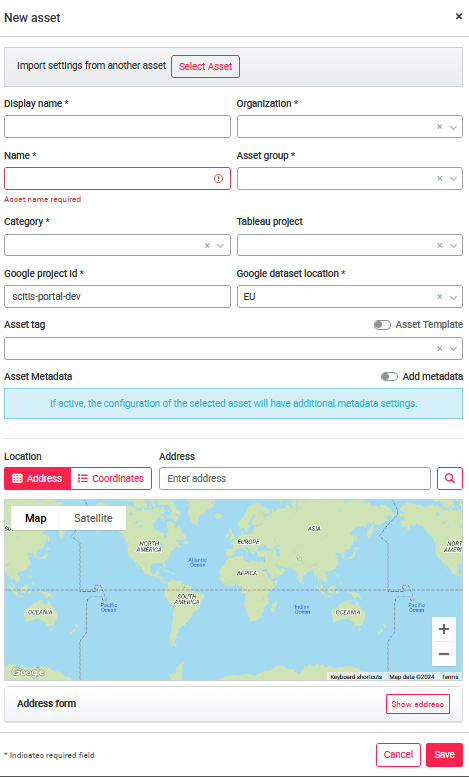
To add a new asset, press the New Asset button in the upper right corner. When adding a new asset, the Display Name, Name, Google Project ID Category, Organization, Asset Group and Google Dataset Location of the asset must be specified. Name, Category and Organization cannot be edited later.
When adding the organization to an asset, make sure to select the correct organization. For a communication of asset and gateway to be possible, both must be stored under the same organization. (For creating a gateway see Gateway administration)
Different asset types are stored in the Category field, one of which must be selected. If a Tableau license is available and a project is correctly created at the organization, under Tableau Project the appropriate project can be selected. The asset is assigned to the selected organization and asset group. In addition, location of the asset can be customized and tags can be assigned.
Tags can be used to apply certain settings to all assets with the same tag. These settings can be changed for any asset with that same tag and will be applied to all assets. Please note: Assumption/requirement is that all gateways of the assets with the same tag have the same configuration and that there is a 1:1 relationship - 1 asset connected to 1 gateway (i.e., same signal names in the BigQuery table).
When creating the tags, please note:
- Tags are unique in combination with the asset category.
- Tags are treated case-insensitive ('tag1' = 'tag1' = 'tAG1' → these are treated the same and stored in lowercase in the backend, but displayed as typed in the UI)
- Spaces in tags are taken into account → 'tag1' is something different from 'tag1'.
The Add metadata function displays the metadata tab in the asset configuration. Existing metadata can be displayed there or the user can add metadata. The activation of the Metadata tab is reserved for admins.
To simplify the setup of the assets, the settings can be copied from one asset to another, including the so-called ADMIN Dashboards (Custom pages that have been made available to all users by an ADMIN). In this case, in the Create Asset pop-up window, the Import settings from another asset button must be selected to copy the general custom pages as well.
07.3.1 Data configuration
One of the most important items of the asset management is the data configuration. You reach the menu by clicking on Action ![]() on the corresponding asset and then on Configuration
on the corresponding asset and then on Configuration ![]() . Here signals can be created and offset.
. Here signals can be created and offset.
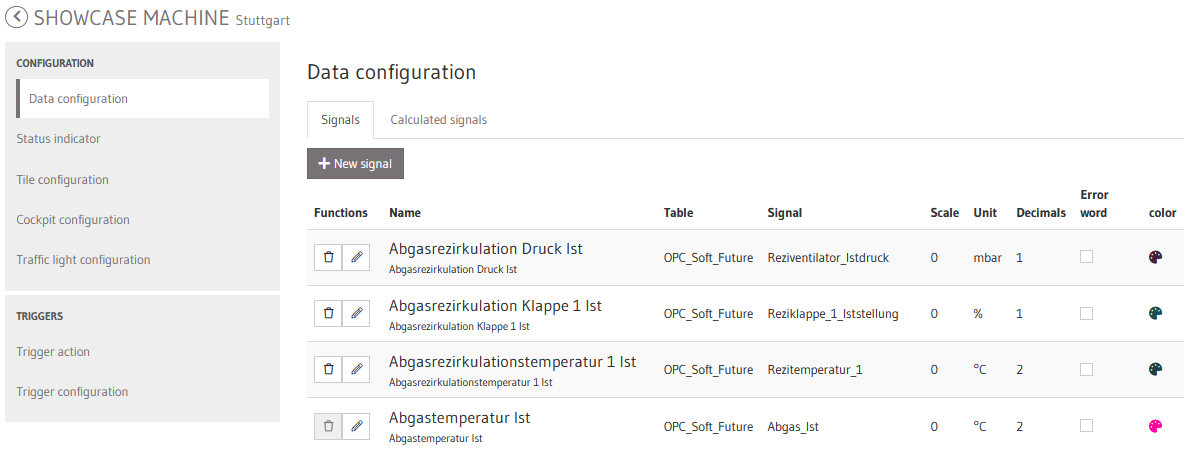
07.3.2 Signals
In the data configuration, the asset signals stored in the BigQuery are added to the portal as a new signal. To add a new signal, press the New signal button.
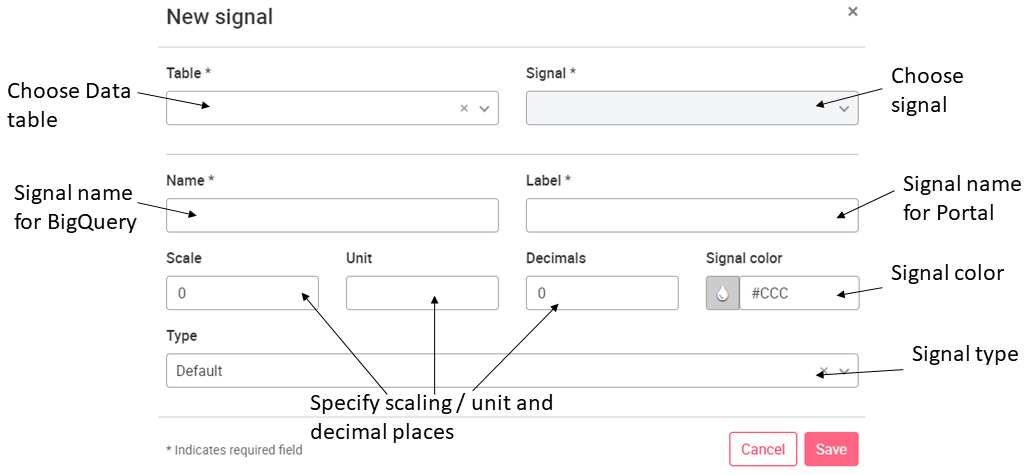
In the pop-up window, first select the table where the data signals are stored. The table is the table created in the BigQuery.
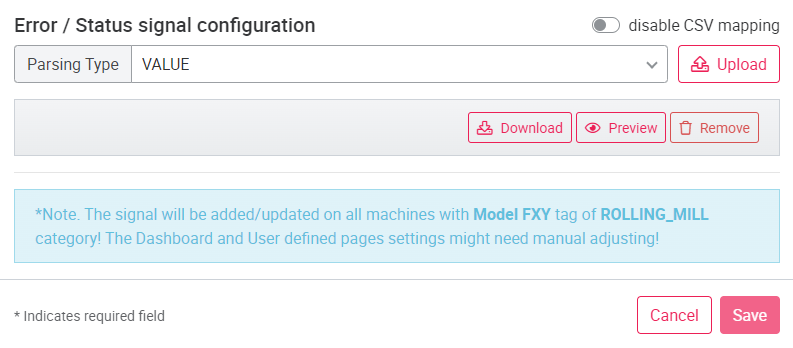
When the table is selected, a selection of available signals is displayed. The name of the selectable signals is the name or alias (depending on what was saved) from the BigQuery table. After the signal is selected, it must be given a name (cannot be changed later, as the name governs the signal assignment on the portal) and a label, which can be freely selected. The scaling and the units can be adjusted. With the drop-down menu Type the signal can be defined as an error word in order to display it on an Error page with the associated data, for this see Data configuration.
Error page under Asset pages. If the type is defined as Error/status signal, you can upload a .CSV file, with the description of the bit or value coded error word and status signals. For bit-encoded signals there is a limit of 64 bits, for value-encoded content the limit is 500 codes. If signals are sent as a string, they can be combined into a string value using the Byte Array function. With the value Default the signal is treated as a normal data signal.
07.3.3 Calculated signals
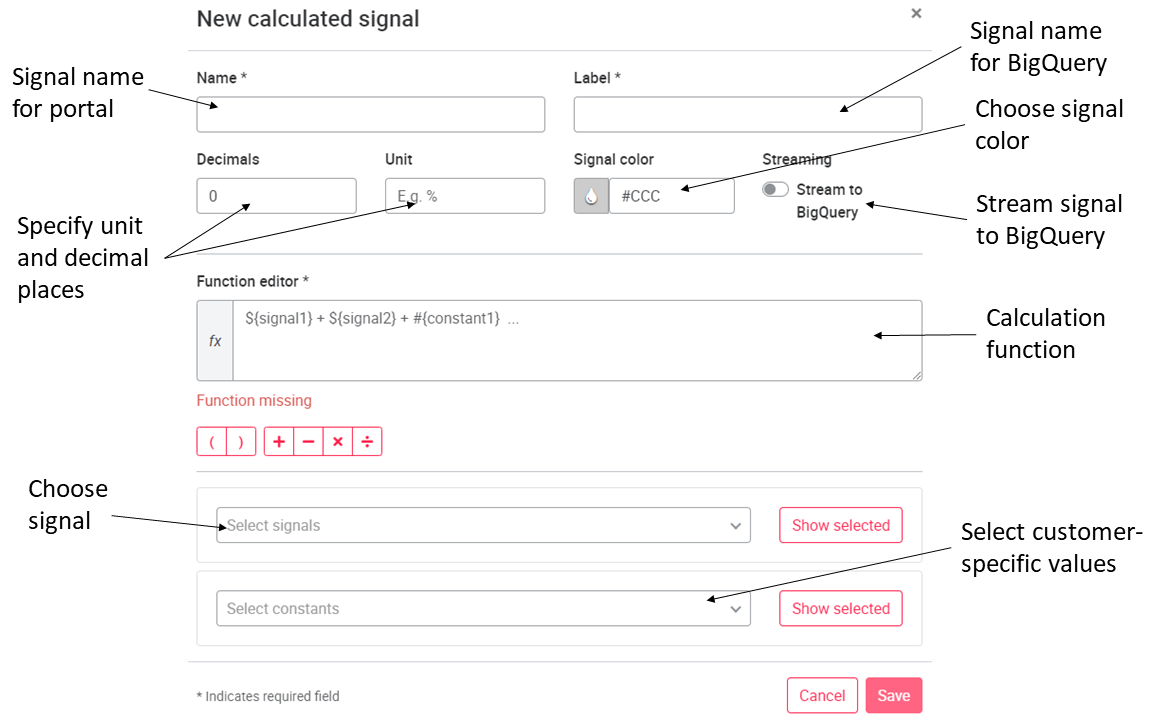
Under Calculated signals, a new signal can be calculated from different signals. The signals to be calculated must first be created under Signals. To create a calculated signal, press the button New calculated signal, top right. New calculated signals must be given a name and a label. Calculated signals can also be streamed to BigQuery by checking the Stream to BigQuery checkbox. A new unit and the setting of decimal places can be assigned individually. The following operators are allowed for calculation: ( ) + - * /
If the "Stream to BigQuery" function is not activated, the signal cannot be displayed in the Interactive Data Analysis. (Display on widgets is still possible).
Note: If a decimal number is used for the calculation function, the decimal number must be separated by a period ".". A comma "," must not be used. Likewise, manual entry of signals into the function window is not possible. Signals must be selected via the signal drop-down window.
Note: Signals can only be calculated with each other if they are configured in the same data stream.
07.3.4 Status signals
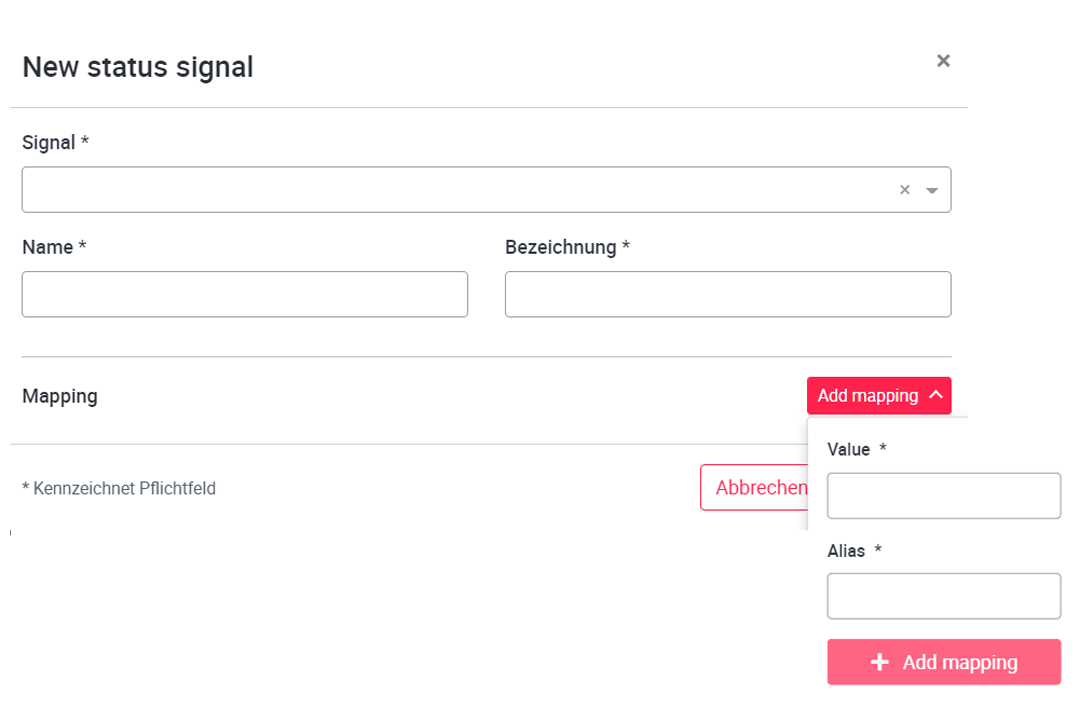
The status signals can be used to convert asset states that an asset sends as an integer signal into text. If, for example, an asset outputs value 1 = running and value 2 = pause, the integer values 1 and 2 can be converted to running and pause as plain text and output as text on the tile, for example.
To create a status signal, open the Signal status tab and click on New status signal. Under Signal the corresponding asset signal can be selected. The signal name and a display name must be assigned to the signal. Use the Add mapping drop-down menu to specify the signal value that is to be translated into a text. Alias is the text that is output for the signal value. With the button ![]() Add mapping the setting can be added and with Save the signal is created.
Add mapping the setting can be added and with Save the signal is created.
Note: the value can only consist of integer positive numeric values.
07.3.5 Status indicator
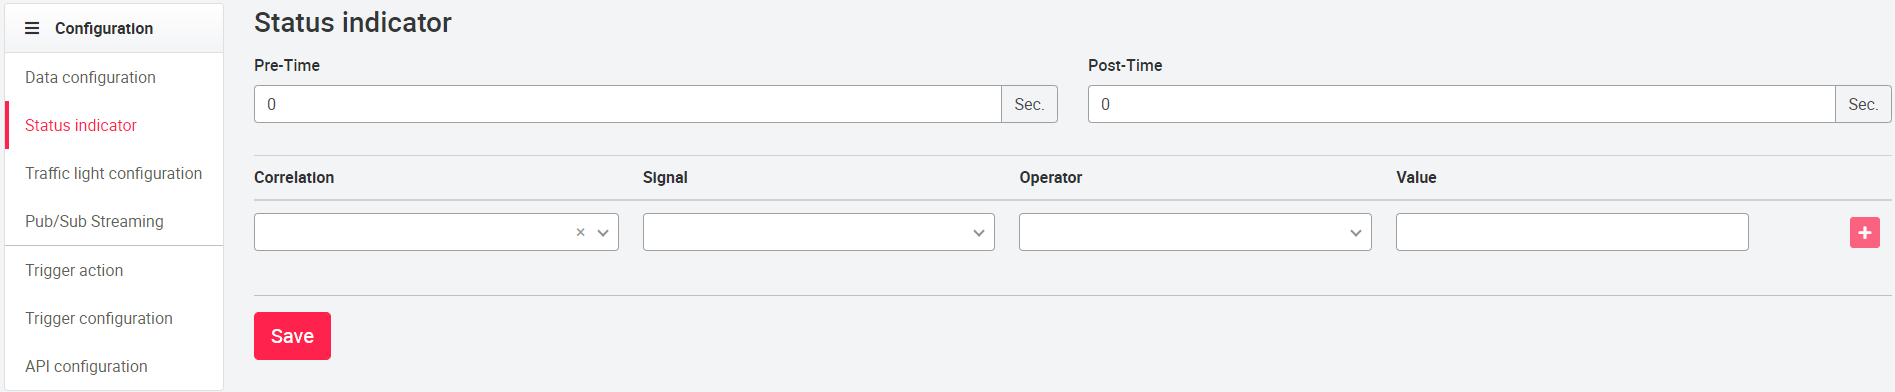
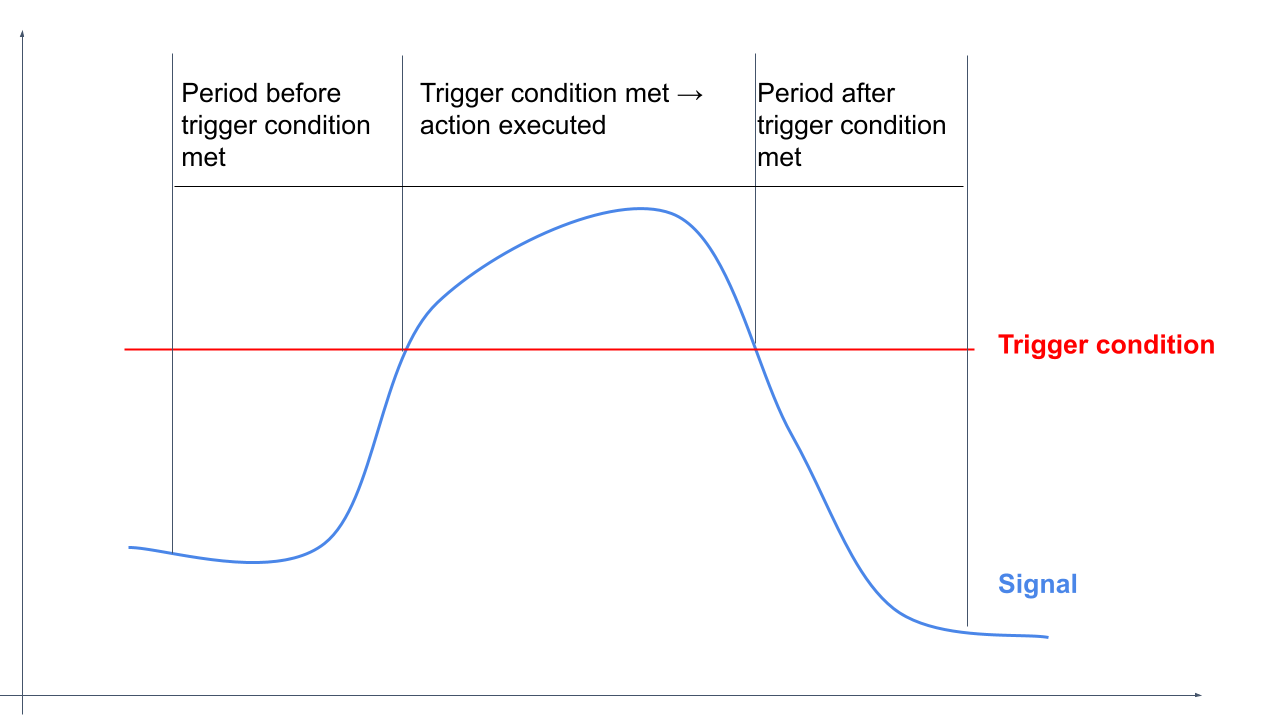
The status indicator sets the value or combination of values at which the Running since status is displayed in the tile (asset status can be found in the dropdown to select the signals shown on the tile as MACHINE STATUS). Pre-trigger and post-trigger time (period before trigger, period after trigger) as well as the corresponding signals, operators (<, >, =) and correlations (AND, OR) can be selected for comparison with values.
By changing or switching the page, the settings will be lost, so it is important to save after defining the state.
07.3.6 Traffic light configuration
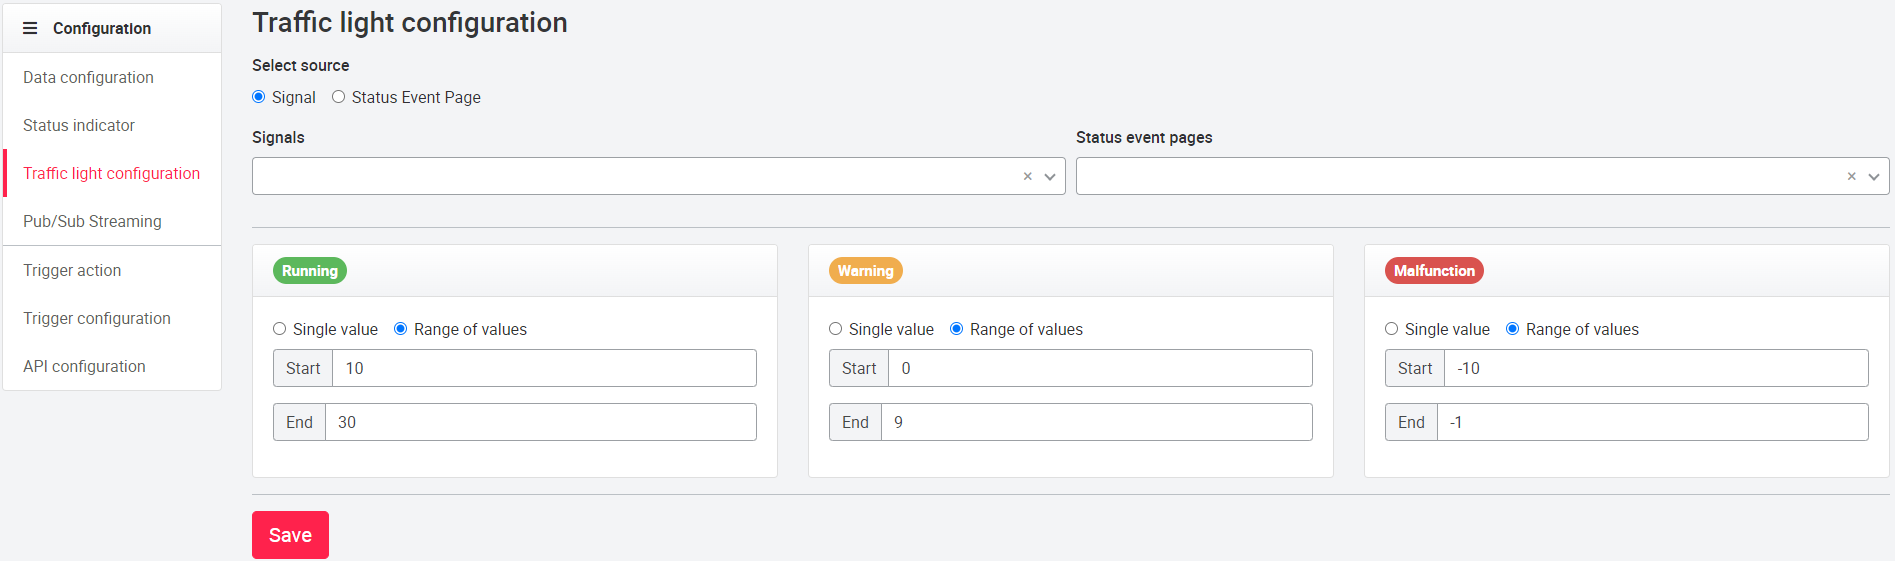
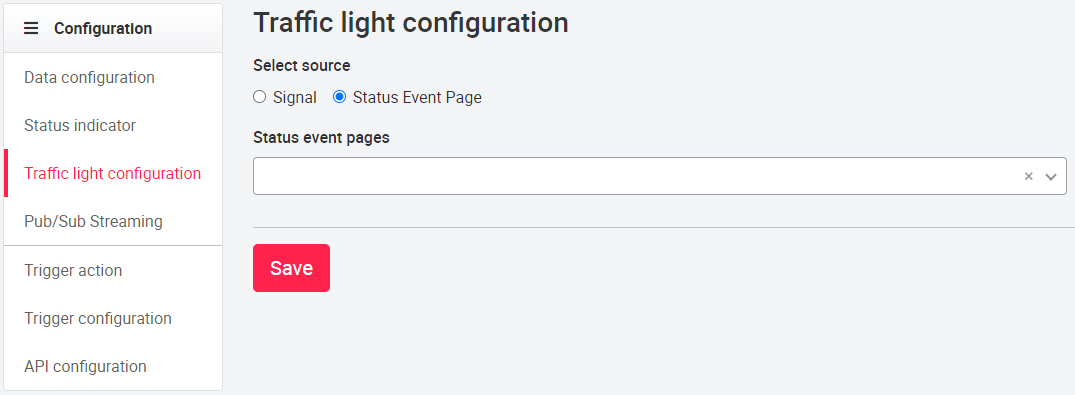
In the traffic light configuration you can select a range of values or a specific value of a signal to display the asset traffic light (colors depending on the organization design) on the tile. You can also select a specific error page. If the asset is in a warning or malfunction, you can click on the asset icon to be taken directly to that specific status page where the errors and warnings are displayed. For the creation of status pages, see Asset pages.
There are two possibilities for the definition of the traffic light colors. In the 'Signal' mode, a signal can be selected and defined using ranges or individual values. The colors are displayed based on the organization design. By selecting a status event page a status page is deposited, to which by clicking on the asset tile is passed on. In the 'Select source' mode, a single status event page can be selected. If this setting is selected, the colors of the traffic lights vary according to the number of information, warnings, errors on the status page:
- 0 - no event on the status page - green (success color).
- 1 - one or more information/block/debug events - blue (info color)
- 2 - one or more warnings - yellow (warning color)
- 3 - one or more errors / faults - red (danger color)
A slider for applying the configuration to assets of the same type can be seen on the user interface. This slider is available only for SUPERADMINS and TECH_ADMINs. Traffic light values can be configured by ADMINS.
When this slider is active, the configuration is automatically applied to assets of the same type, including any newly added assets of the same type. If the slider is disabled, the traffic light configuration is maintained and not deleted, but the signal status of the asset is not visible. If the status of the asset cannot be evaluated or the start and end values are outside the range of all three traffic lights, the color is gray/dark.
07.3.7 Trigger Action
In the Trigger area, asset-specific trigger actions can be created and executed via the portal and gateway. A trigger action is an action that is triggered after one or more defined conditions occur. For example, a trigger action may consist of sending a warning email after a certain temperature has been exceeded.
To create a trigger action, click New Trigger Action in the upper right corner. The action must be given a name (name can be freely chosen, but must not be the same as an existing trigger action).
Each trigger action can be delayed for a given period of time. For this purpose, a time period in seconds can be selected in the Delay field. The delay is started after the activation of a trigger. This means that a trigger action that starts at a certain time can be delayed individually. This can be useful for data queries, for example, if the data is to be queried by 12:00. Transmission delays may mean that not all data is ready for a query at 12:00, in which case a delay can be created to query the data until 12:00 later when all data is safely available.
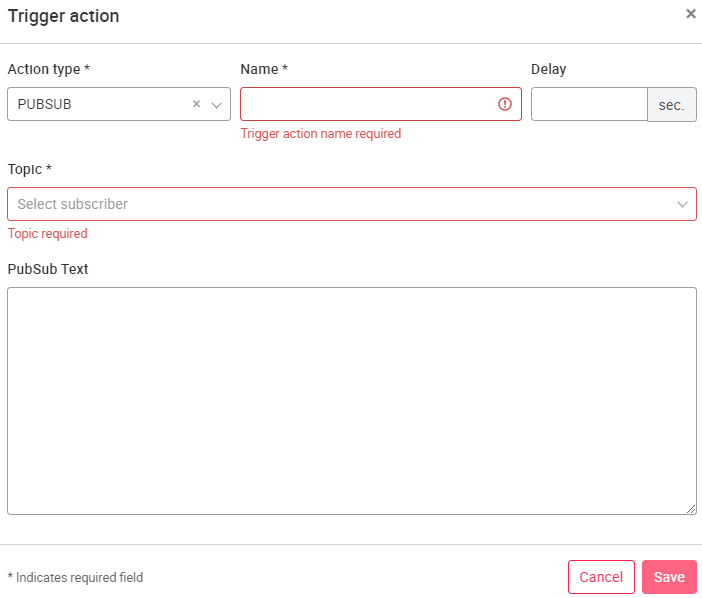
Trigger actions can be selected between different action types: E-MAIL, API_QUERY, QUERY, REFRESH, PUBSUB and NOTIFICATION.
In the following, the different action types are explained further in each case.
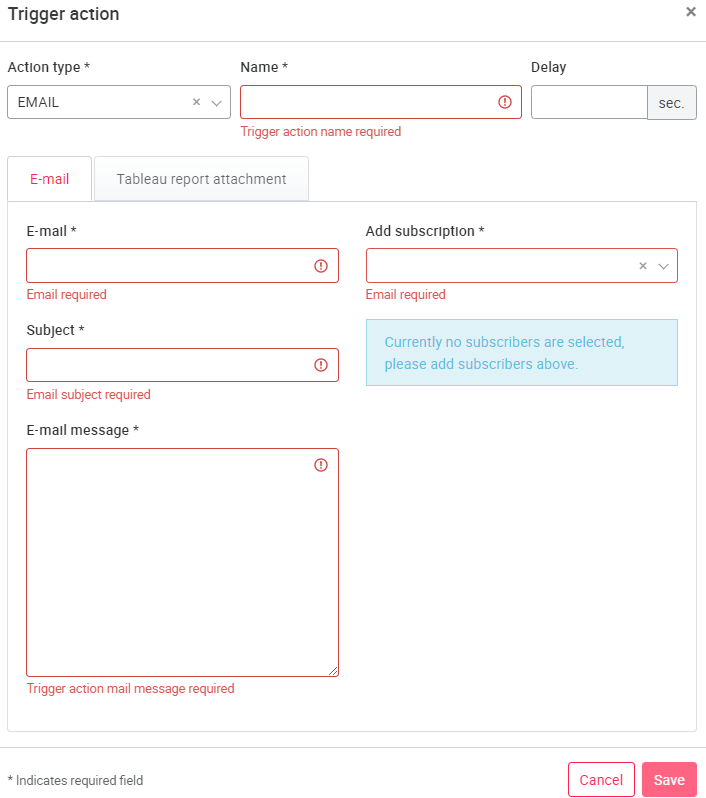
E-MAIL: If you select the E-MAIL action type, you can create a trigger email that will be sent to the specified email addresses when a trigger event (self-defined, for example, a value overrun) occurs.
Multiple email addresses can be specified, separated by "," or ";" without spaces between the addresses (example: "Name@exampe.de;Name2@example.de"). In the e-mail template, you can compose a text yourself. In addition, variables can be used to send specific asset data in the generated e-mail. The available variables are listed in the following table. (All time variables refer to UTC time, behind the time the text UTC is displayed accordingly).
| Variable | Function | Output text |
|---|---|---|
| @machine | asset name | example asset |
| @cloudplugName | gateway name | example cpname |
| @triggerName | trigger name | example trigger |
| @start | start time | 2020-01-29 21:08:25.000 UTC |
| @end | stop time | 020-02-12 11:37:38.900 UTC |
| @cloudplugId | Gateway ID | CP1234567890 |
| @condition | trigger was fired because condition "XY" occurred | value name VALUE CHANGED / CONDITION |
| @signalvalue | signal name as string and the last value | value name = 224.8709 |
| @triggeraction | name of trigger action | example trigger |
| @startCondition | Shows when a condition was met | 2021-01-20 14:25:30.900 UTC |
| @endCondition | Shows when a condition was no longer fulfilled | 2021-01-20 15:27:01.600 UTC |
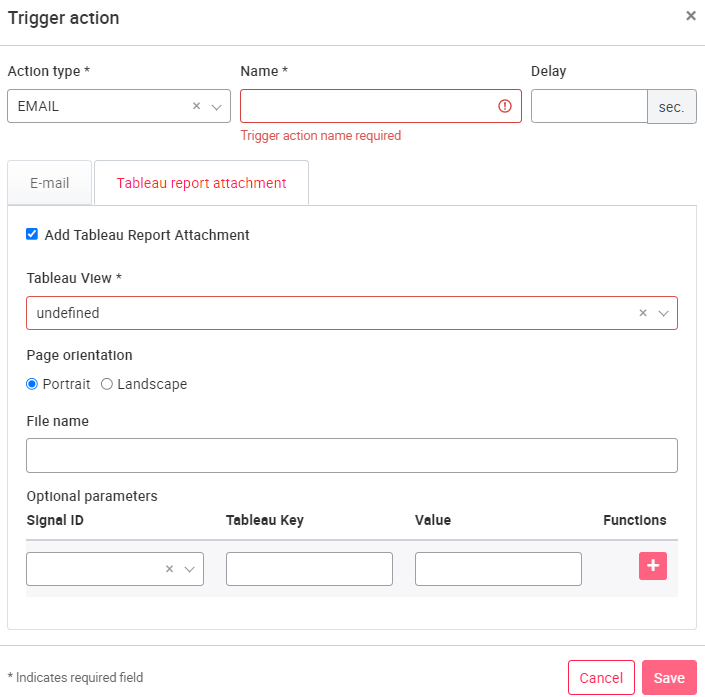
Tableau Report: The Tableau Report as Attachment feature provides the ability to attach existing Tableau views to the trigger email. The file is added to the email as a .pdf and reflects the corresponding Tableau view at the time of the trigger. Specific Tableau views, for example at a specified time, can be specified via additional parameters.
You can select a corresponding Tableau view from the Tableau View drop-down menu (the view must have been previously created on Tableau Server to be selected). You can use the checkboxes to select whether the file is created in portrait or landscape format and assign it a file name.
QUERY: The QUERY action type arranges data from the data stream into a target table. This table is created if it does not exist. To do this, you enter the name of the trigger action and, under Target Table, the target table in which the data is to be stored. A specific column can be specified at the Partition column. Under the tab Init query you specify which values are to be taken from the stream and with which declaration (name) they are to be processed further.
The Refresh Query tab defines how and where the values are to be stored in the table. Here, you can specify specific values by clicking on Extract placeholders. The placeholders appear in the upper right corner. For verification purposes, the new query can be output via Generate test query.
The query commands must be written in Query SQL. (Commands see: https://www.codecademy.com/articles/sql-commands)
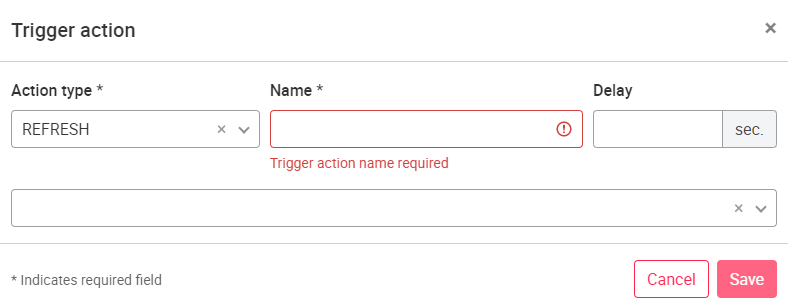
REFRESH: The REFRESH action type allows tableau extracts to be updated in case of a trigger event. It is possible to select multiple extracts from the dropdown menu that will be updated after the trigger event. Similar to the Tableau views, the default projects are also displayed. If there is no default project or it cannot be found, only the selected project will be used. If the user sets the tableau project of the asset to none, all found projects with their data sets are used.
PUBSUB: This trigger action sends a message to a specified pub/sub topic. The message contains all available trigger parameters in json format. The pub/sub theme is configured by the GCP administrator in the Google Cloud Console. Since they are mostly the portal operators, only SUPERADMINs can also add this trigger action and assign it to a trigger in the trigger configuration. However, it opens the possibility to execute e.g. Cloud Functions or other commands based on a trigger, e.g. if a value changes or a shift is over.
This function is only available for SUPERADMINs. For setting up the pub/sub function, see Advanced functionality for portal operators.
All possible defined parameters (see trigger action email) are sent to Pub/Sub. To specify these parameters more precisely, it is possible to specify in a text field what exactly should be sent to Pub/Sub. Similar to the trigger action e-mail, the parameters are replaced with the corresponding values.
NOTIFICATION: Trigger actions in NOTIFICATION are displayed in the Notification Center, see Notification Center. These notifications are configured like the trigger action EMAIL: Portal users can be selected as recipients and a free text can be created with links or the same parameters as for the EMAIL action type.
If too many notifications accumulate in the notification list, this leads to a poorly manageable amount of information. Therefore, various mechanisms have been integrated to contribute to clarity:
- Notifications that have already been read by a user are automatically deleted for all subscribed users.
- Notifications that refer to a gateway being offline are deleted as soon as the gateway is back online.
- Notifications older than a specified time span are automatically removed. By default, a time span of 3 months is set. This time span can be customized by each user. Using a text field in My Account (see Header and Logout), the user can enter the number of days that unread notifications should be kept (maximum is 3 months).

Already created triggers can be edited ![]() and deleted
and deleted ![]() with the buttons to the left of the trigger name, but only if the corresponding trigger configuration (see Trigger configuration) is disabled.
with the buttons to the left of the trigger name, but only if the corresponding trigger configuration (see Trigger configuration) is disabled.
07.3.8 Trigger configuration
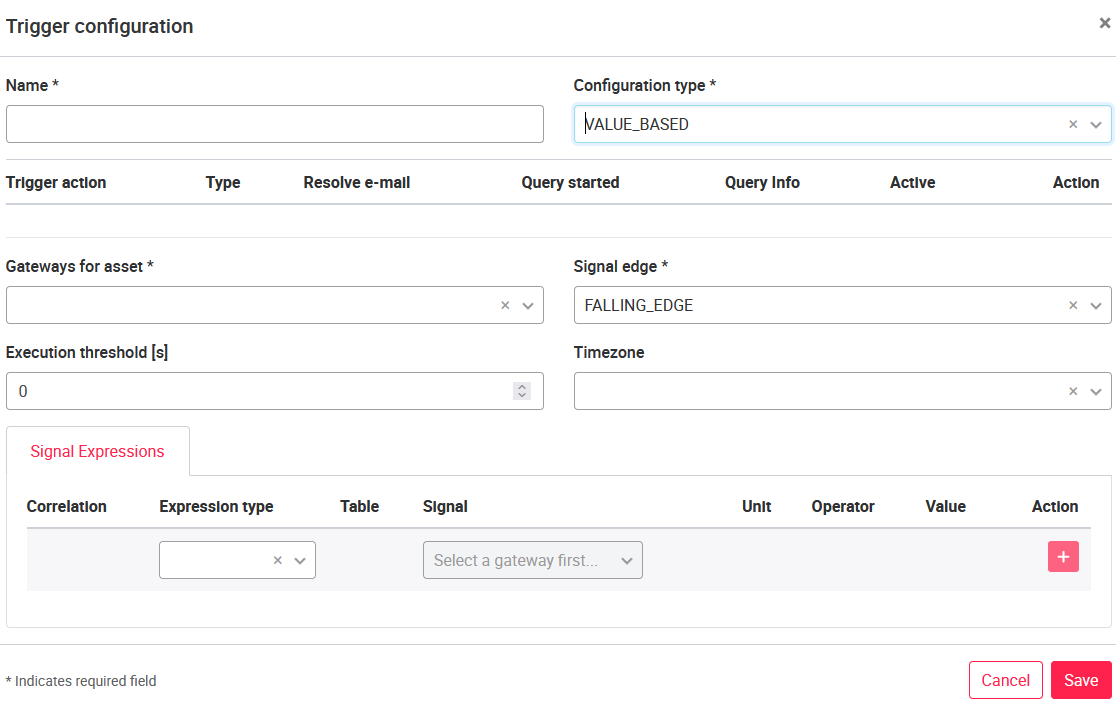
For configuration types, there is a choice between:
REAL_TIME_BASED: The configuration type REAL_TIME_BASED refers to the cyclic execution of the trigger query. The time interval and the start time can be selected (for example, an e-mail with a specific current data value can be sent once a day). All settings of the REAL_TIME_BASED trigger refer to the real time UTC.
TIME_BASED: The TIME_BASED configuration type refers to the cyclic execution of the trigger query. The time interval and the start time can be selected (for example, once a day an e-mail with a certain current data value can be sent). All settings of the TIME_BASED trigger refer to the time that is set in the gateway.
VALUE_BASED (Signal Expression): The VALUE_BASED type refers to one or more signals to execute the trigger query. In both cases, a signal edge (RISING_EDGE, FALLING_EDGE or BOTH) and an execution threshold (0 - 7200 seconds) must first be selected. The signal edge specifies whether the values are to be falling, rising or both. The execution threshold in X seconds defines after which permanent exceeding time of X seconds a trigger should be released (for example, if at an execution threshold of 10 seconds a value exceeds this threshold for more than 10 seconds, a trigger action is released). If the execution threshold is 0, there will be no time-based triggering and the trigger will respond as before. Value based trigger conditions can be applied to signals with numbers (int, float) as well as byte arrays (string).
Then an expression type must be selected for the trigger. There is a choice between: VALUE_CHANGE, CONDITION, NULLEVALUATION and TIME_EVAL.
VALUE_CHANGE selects a signal and executes the trigger when the value of the signal changes.
CONDITION defines a precise condition for the execution of the trigger. The current signal value is compared with a self-selected value using an operator (greater than >, less than <, equal to =, not equal !=). If the condition is met, the trigger is activated. Several signals can be set in correlation (AND, OR) to each other.
With NULLEVALUATION a trigger action can be activated for empty data strings (NULL). TIME_EVAL is a time evaluation. Specific time and day intervals can be created by the operators (>, <, =) at which a trigger action is to be triggered.
VALUE_BASED (Time Expression) With the condition type for times, a trigger can be triggered when a certain time is reached. The prerequisite is, however, that in the gateway configuration in the tab 'Pub/Sub-Streaming' the streaming is activated. Now the triggers are handled by another process that allows the creation of time conditions.
Time conditions can be created via the Time Expressions tab. You can choose between daily, weekly and monthly times and specify the time/day when the trigger should be triggered. In addition, the time zone at which the time is queried can be set. If an email is sent with time-based parameters (e.g. @start), UTC time will be used.
Both conditions are used for executing the trigger action: For example, if the signal condition is not met, the time condition is used to trigger the trigger action.
This function is available to all user roles that can configure triggers.
TRIGGER_BASED: The trigger is triggered by a preceding query trigger event and can, for example, send an email when a preceding trigger has triggered a query function. The TRIGGER_BASED type refers to one or more signals to execute the trigger query. In both cases, a signal edge (RISING_EDGE, FALLING_EDGE or BOTH) must first be selected. Then the expression type must be selected.
There is a choice between VALUE_CHANGE, CONDITION and NULLEVALUATION.
VALUE_CHANGE selects a signal and executes the trigger when the value of the signal changes.
CONDITION defines a precise condition for the execution of the trigger. The current signal value is compared with a self-selected value using an operator (greater than >, less than <, equal to =, not equal !=). If the condition is met, the trigger is activated. Several signals can be set in correlation (AND, OR) to each other. With NULLEVALUATION a trigger action can be activated with empty data strings or the value 0. With NULLEVALUATION a trigger action can be activated with empty data strings (NULL).
OPC_OFFLINE: The configuration type OPC_OFFLINE triggers a trigger action if the gateway is not reachable for a certain time interval. The time interval to be checked can be specified in minutes or hours. After the gateway is reachable again, the same trigger action is executed again. For example, the trigger can send an e-mail indicating that the gateway is offline. As soon as the trigger is online again, another e-mail is sent with the information about the online status.
OPC_NO_DATA: The configuration type OPC_NO_DATA triggers a trigger action if the gateway is reachable but no data transfer takes place. After the trigger sends data again, the same trigger action is executed again. For example, the trigger can send an email when the gateway is not sending data. As soon as the trigger sends again, another e-mail is sent, with the information about the send status.
NEW_ROWS_APPENDED: The NEW_ROWS_APPENDED configuration type fires a trigger action when new rows of data are discovered in a defined BigQuery table. This trigger configuration is specifically intended for the REFRESH trigger action. Thus, for example, a data update for the Tableau view can be triggered via the trigger action.
After creating a trigger configuration must be activated for the execution of the trigger. To do this, click on Action
and there on Activate
.
Trigger configurations can be edited, even while the trigger is active. However, they can only be deleted if the trigger configuration is disabled. You can see the status of the trigger configuration under Active. To deactivate a trigger configuration, click Action ![]() and there click Deactivate
and there click Deactivate ![]() .
.
To test a trigger configuration or trigger action, you can use the Force trigger button ![]() . The Force Trigger button can be found under Action
. The Force Trigger button can be found under Action ![]() next to the Activate button. After pressing it, a corresponding trigger action is started once, regardless of the trigger criteria.
next to the Activate button. After pressing it, a corresponding trigger action is started once, regardless of the trigger criteria.
Current restrictions: No trigger execution possible if both ADC and Modbus signals are configured. This means no triggers can be obtained based on two data streams and streamed to two different BigQuery tables. A zero point exception is still available.
07.3.9 API configuration
API configuration enables the integration of the organization's own MES/ERP system into the platform. The interface is created via ![]() New API endpoint. This requires a valid API URL and the selection of an action. Once created, the MES/ERP system can make a request to the portal via the established REST interface to obtain information.
New API endpoint. This requires a valid API URL and the selection of an action. Once created, the MES/ERP system can make a request to the portal via the established REST interface to obtain information.
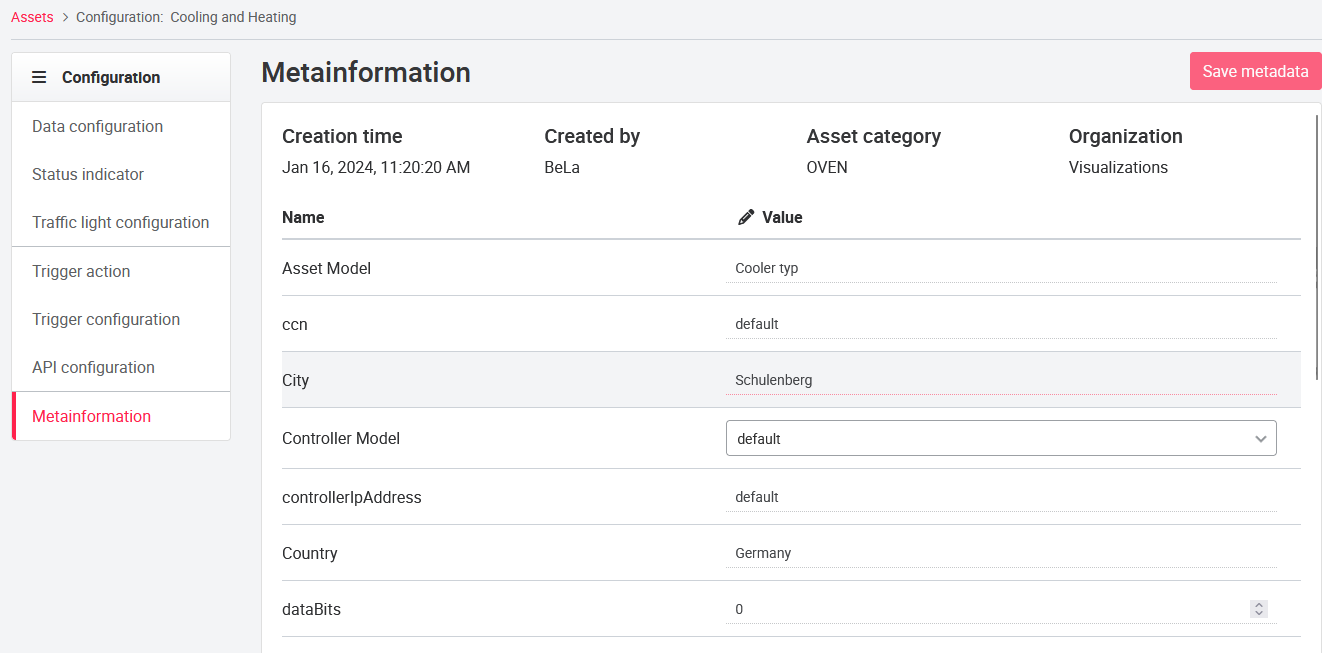
07.3.10 Metainformation (Optional)
If the Metainformation tab is enabled by an admin, you can see various metainformation of the asset on this page. The information can be created and edited via API or the UI. To make metadata usable for the user see Portal-specific input fields for assets and gateways
!
07.4 Asset Group Administration.
The asset group administration page (Asset Groups) is located in the header of the portal in the user drop-down, under Settings.
!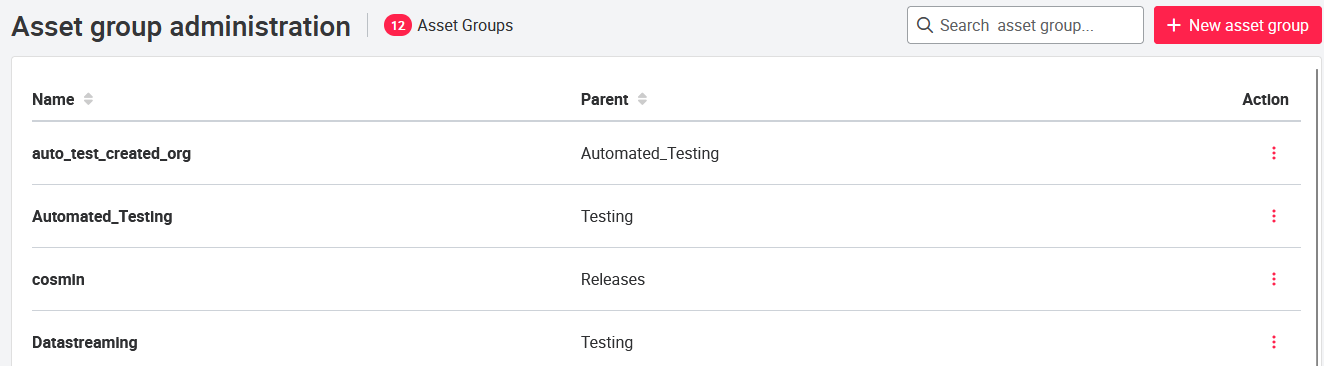
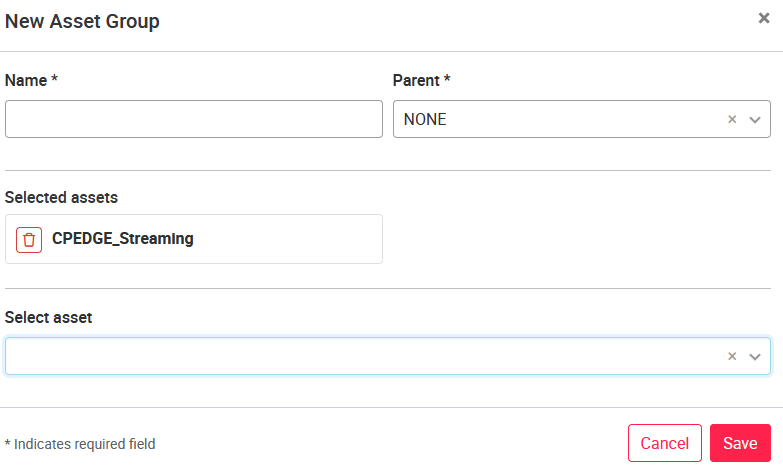
In the asset group administration, new asset groups can be added by clicking the New Asset Group button in the upper right corner. When you add a new asset group, you must specify the name of the asset group and assign a parent node (parent group) to it. Which asset group and parent node are selected is a matter of authorization and depends on which hierarchy is to be created.
Depending on the authorization, additional assets can be added directly when the asset group is created. Only existing assets can be added to an asset group. Only assets that are in your personal asset group can be added to another asset group.
To create an asset, see Asset administration.
Existing asset groups can be deleted and edited under action ![]() . The gear button (configuration) can be used to display details such as assets, users and groups for the respective asset group.
. The gear button (configuration) can be used to display details such as assets, users and groups for the respective asset group.
Attention: Asset groups can only be deleted if no asset is assigned to the group. If an asset is assigned to an asset group, the group can not be deleted!
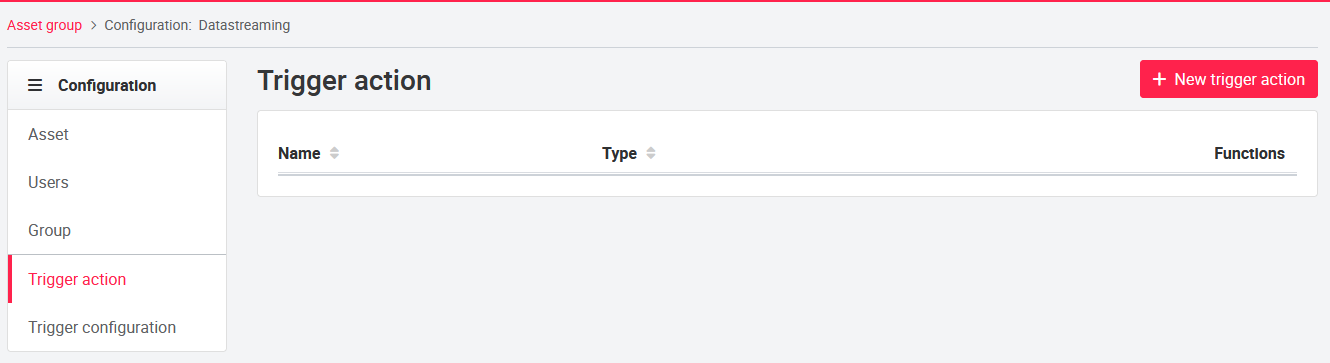
07.4.1 Asset group trigger
Like for assets, trigger can also be created for asset groups. The division of the configuration is the same like for the asset in trigger action and trigger configuration. For configuration of a trigger action, see chapter Trigger Action. Action types for asset groups are currently limited to the Email type.
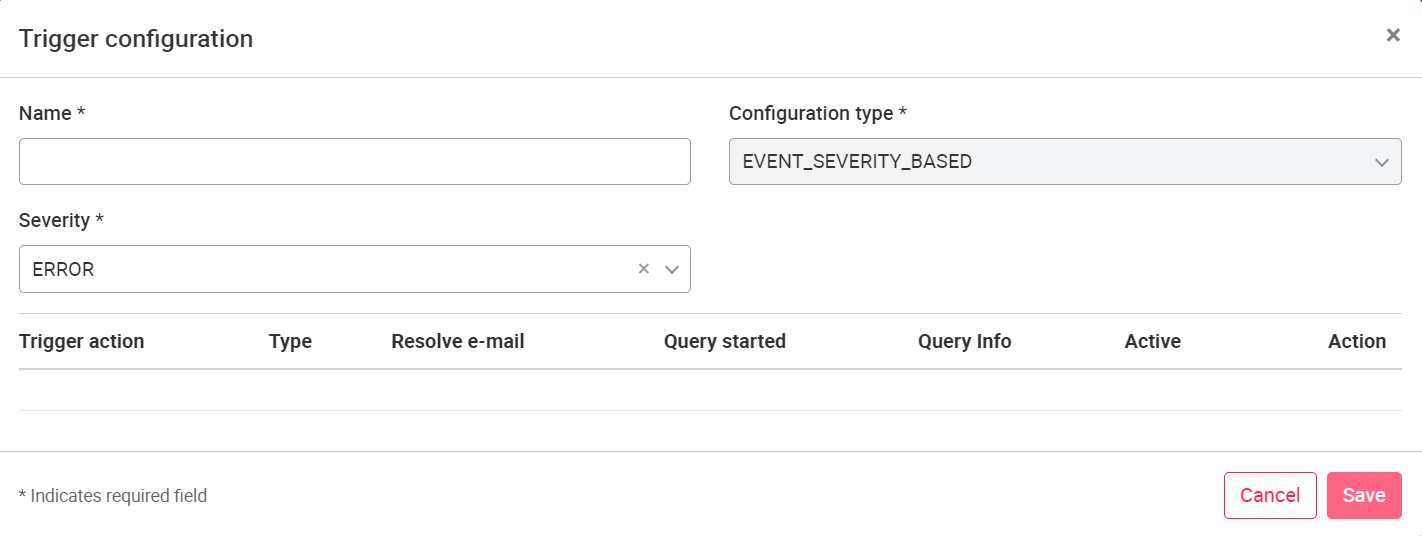
Trigger configurations are currently limited to the EVENT_SEVERITY_BASED and VALUE BASED configuration types. For the EVENT_SEVERITY_BASED configuration type, the ERROR, WARNING, INFO, DEBUG and INHIBIT severity levels can be selected.
With the VALUE BASED trigger configuration, triggers can be triggered based on values, e.g. when the value of a single signal is exceeded. The VALUE BASED trigger is configured in the same way as for assets, for details see chapter Trigger configuration.
Triggers can be configured by users at the asset group level (available for SUPERADMIN, TECHADMIN, ADMIN and DISTRIBUTOR). All assets in this group will then be subject to the defined trigger. The trigger associated with the group is added / removed when an asset is added to or removed from that group.

07.5 Gateway Administration
The Gateway Administration (Gateways) page is located in the header of the portal in the user dropdown, under Settings.
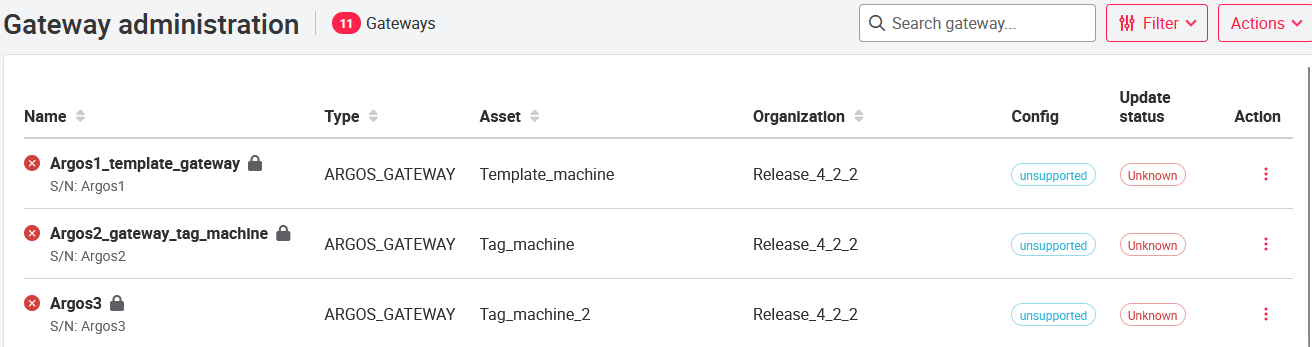
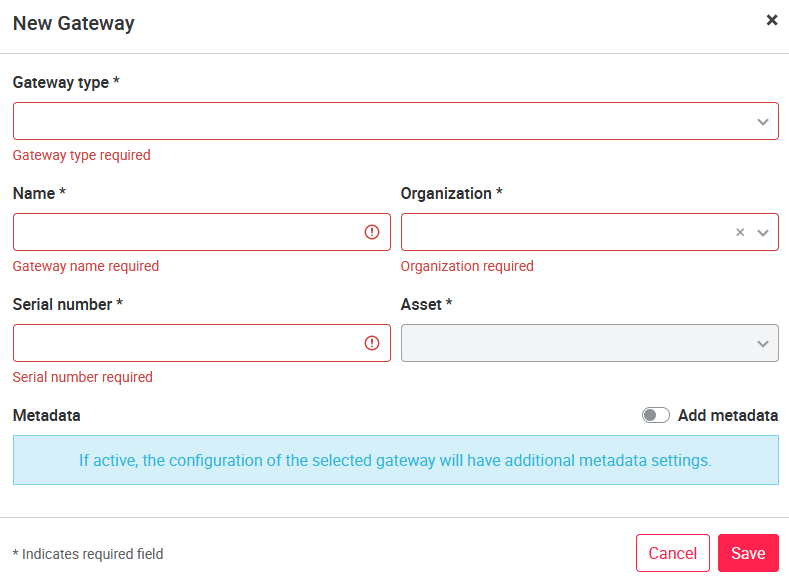
In the gateway management you can add a new gateway by pressing Action (top right) and in this dropdown menu New gateway. When a new gateway is created, the gateway type, name, serial number, organization and asset must be specified.
There is a choice between the gateways:
- Cloudplug One (CPONE) Cloudplug first generation (hardware).
- Cloudplug Edge (CPEDGE) Cloudplug second generation (hardware)
- Cloudplug Light (CPLIGHT) Cloudplug reduced power (hardware)
- GENERIC Software (configuration of a generic gateway)
- ARGOS_GATEWAY software (configuration of an Argos gateway)
The Cloudplug Light and GENERIC have additional configuration options: Source Cloudplug Light, IoT Core Region, IoT Core Registry ID are available. The Cloudplug Light also provides the option to copy the setting of another Cloudplug Light (checkbox Copy settings from other CPLIGHT). If the setting of another Cloudplug Light is to be copied, the source Cloudplug Light dropdown menu is unlocked and a Cloudplug can be selected from which the data will be copied. IoT Core Region describes in which region the IoT Core is located and the IoT Core Registry ID is the serial number of the IoT Core.
The Add metadata function displays the metadata tab in the gateway configuration. Existing metadata can be displayed there or the user can add metadata. The activation of the Metadata tab is reserved for admins.
Caution: Gateway settings cannot be changed once created. When adding the organization to the gateway, be sure to select the correct organization. For communication of asset and gateway to be possible, both must be deposited with the same organization. (For creating an asset, see Asset administration).
For physical cloudplugs, the serial number can be read on the device. For soft cloudplugs, the serial number counts up from V000001.
Via action ![]() the gateways can be removed
the gateways can be removed ![]() , gateway details
, gateway details ![]() can be displayed or the secret key can be reset
can be displayed or the secret key can be reset ![]() . In the details there is access to details, functions, services, protocols and connections depending on the type of gateway. The Secret Key represents the authenticated, secure connection from the gateway to the IoT core. If this connection exists, a green dot can be seen under Authenticated connection for the corresponding gateway.
. In the details there is access to details, functions, services, protocols and connections depending on the type of gateway. The Secret Key represents the authenticated, secure connection from the gateway to the IoT core. If this connection exists, a green dot can be seen under Authenticated connection for the corresponding gateway.
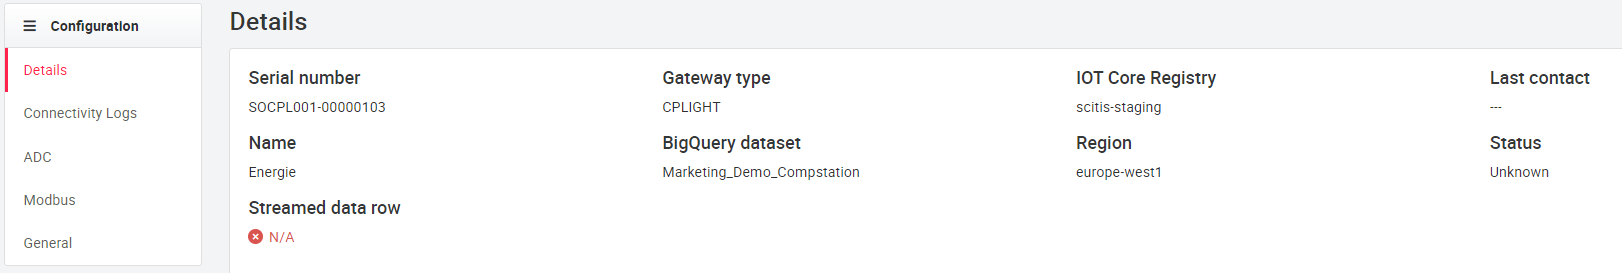
07.5.1 Gateway configuration
The Details menu, accessible via Action and the gear button (![]() Details). There the serial number of the gateway, name, BigQuery record, OPCUA table, time of the last update and restart as well as the installed packages and their status are specified. Revision stands for the package version installed on the gateway and Candidate for the package version available on the update server.
Details). There the serial number of the gateway, name, BigQuery record, OPCUA table, time of the last update and restart as well as the installed packages and their status are specified. Revision stands for the package version installed on the gateway and Candidate for the package version available on the update server.
All of the following configuration settings apply to Cloudplug One, Two, and Soft. The Cloudplug Light has its own setting options, see Cloudplug Light configuration.
In Functions you can update the software, upload the cloudplug configuration (to the cloud), download a cloudplug configuration (from another cloudplug), restart the cloudplug and request the logs. By initiating a cloudplug software update, the cloudplug starts an update process and updates the entire system. The cloudplug is then automatically restarted and the timestamp of the last update is displayed.
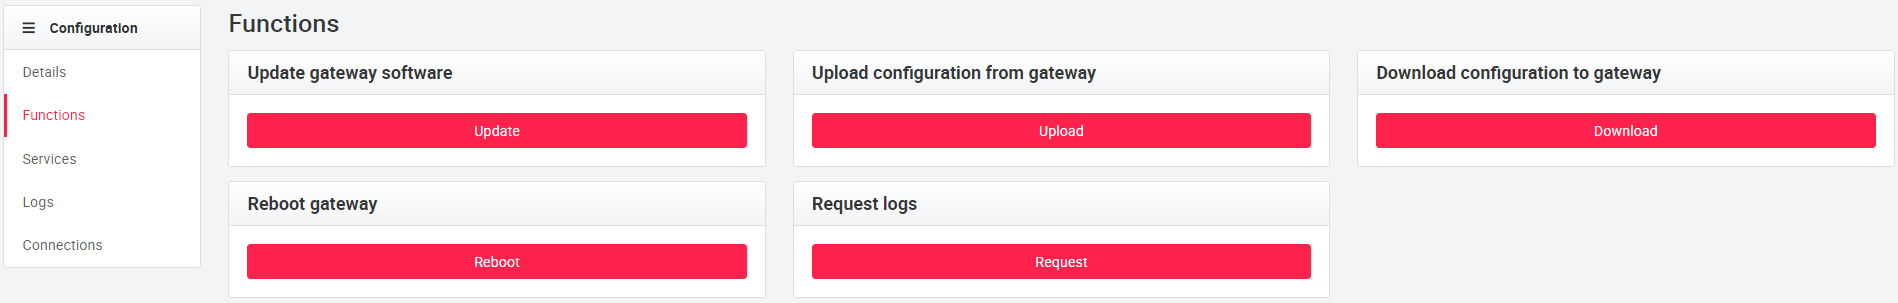
During the configuration upload, the cloud plug loads the configuration into the backend. The configuration is transferred as a .tar.gz archive and stored in the cloud storage.
During the configuration download, the configuration stored in the backend is downloaded and installed. It may be necessary to restart the Cloudplug services to apply the configuration changes. The interface indicates whether a configuration file exists for the cloudplug.
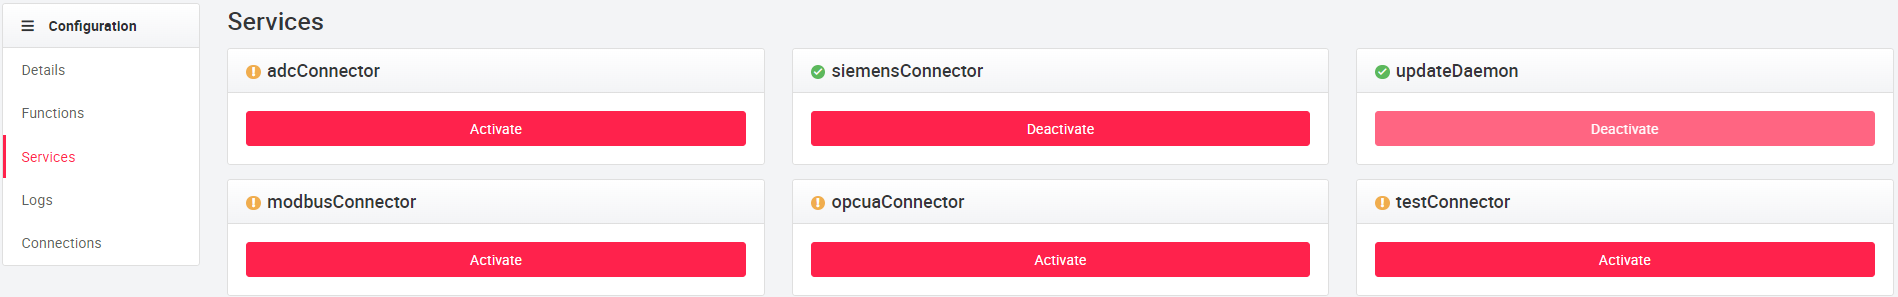
In Services the different services of the Cloudplug can be (de)activated: the fileConnector, updateDaemon, opcuaConnector, ibaConnector, mirrorConnector, testConnector and the mysqlConnector. updateDaemon is for connecting to the cloudplug, this service cannot be disabled. Opcua, Morror and testConnector are the connection points of the cloudplug. Individual interfaces of the Cloudplug can be enabled or disabled by (dis)enabling them.
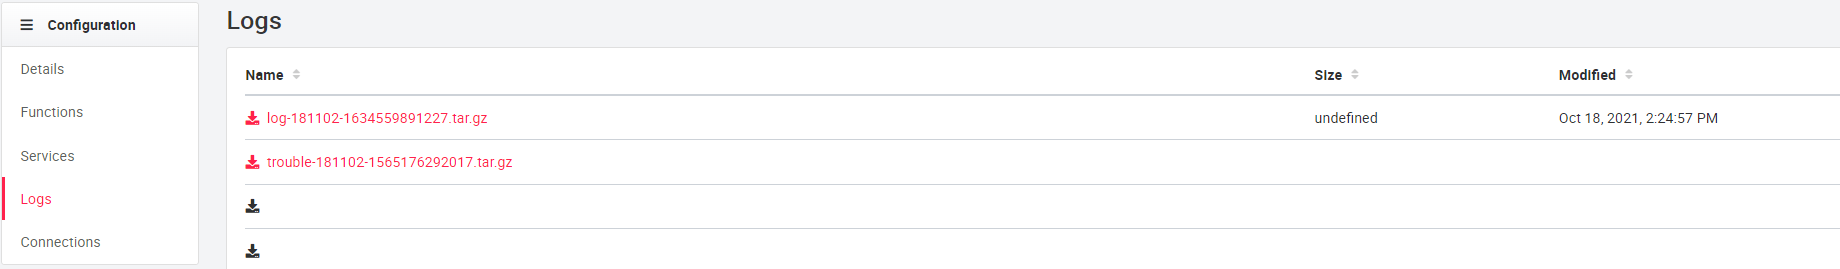
Available log files are displayed in Logs. By clicking on the file name with the extension .tar.gz the corresponding log file can be downloaded.
The Connections tab shows the data synchronization between the cloud plug and the cloud platform. The signals created in the gateway, for example the cloud plug, are loaded as soon as there is a connection between the gateway and the portal. The connections in the portal represent a simplification of the data stream by replacing the complex asset code with more readable aliases. This significantly improves clarity. After the table is loaded, the signals must be activated to stream the signals into the BigQuery. If the signals are new, the BigQuery table is extended accordingly. BigQuery table will be expanded accordingly. (The TST table that may be present is a test table of the cloudplug to check the connection between the cloudplug and the portal, this table has no configuration capabilities on the cloudplug. The table can be removed if needed).
Attention: if the data type of the signal is changed in the cloud plug, the signal name must also be changed. The data type of the signal must also be adapted in the alias table in the portal. If the data type is not adjusted, no data is streamed into the BigQuery, since only one data type is stored in each column of the BigQuery. Therefore, a new column must be created in the BigQuery when the data type is changed.
Customize the data type in the portal: export alias table → change data type of the signal → import table → save
If the name of the signal is changed in the cloud plug, a new alias is created in the table. The old alias remains in the portal and is still active, but writes only NULL to the corresponding BigQuery table. Newly created signals are created in the connection table as disabled and must be enabled before use.
Alias tables can be modified using the edit button ![]() . The regular expression of an alias table represents a scheme that is applied to all configured signals in the table. For example, this setting can be used to replace an 'ä' with an 'a' for all signals at the same time. These settings are applied to all signals to which the regular expression applies. (The final regular expressions are examples, they are already applied accordingly in the background).
. The regular expression of an alias table represents a scheme that is applied to all configured signals in the table. For example, this setting can be used to replace an 'ä' with an 'a' for all signals at the same time. These settings are applied to all signals to which the regular expression applies. (The final regular expressions are examples, they are already applied accordingly in the background).
Arrays (optional) can be used to combine configured signals of the connection into an array to display them bundled in a diagram. (This is a special application that is not supported by the widgets by default. If you are interested in this feature, please contact your portal administrator or your contact at scitis.io). To add a new array, use the New Array button ![]() added. The array must be assigned a name and a data type. The corresponding signals can then be selected in the dropdown menu.
added. The array must be assigned a name and a data type. The corresponding signals can then be selected in the dropdown menu.
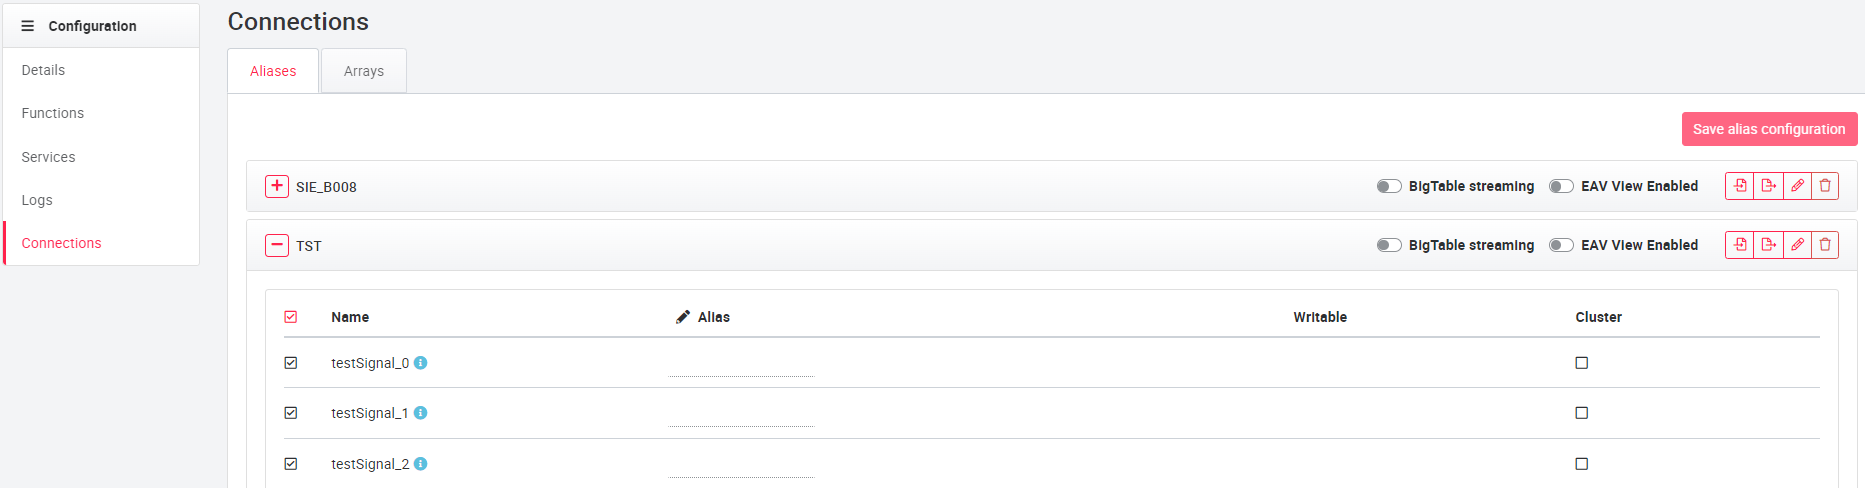
With the Cluster function below the Import and Export function, up to four connections can be combined into a cluster within the BigQuery table. This function is intended for data that is frequently queried or for signals that remain constant over a period of time, such as the ID of a production lot. The advantage of a cluster is that when the data is queried frequently, not all the data from the BigQuery is loaded, but only the data from the cluster, which significantly reduces the loading time. The selected connections are displayed under the connections in the Cluster area and can be deleted at any time. Based on the order (recognizable by the index) the data in the cluster is queried, therefore it makes sense to position connections that are queried more frequently higher up in the list (the smaller the index, the higher up).
When a connection list is deleted, the entire alias table in the portal is deleted. The created signals on the cloud plug will still exist and will be streamed to the portal again when the connections are updated. There are various options for updating the tables:
- Restart the connector on the cloud plug that matches the alias table.
- Restart the cloud plug
- Export alias table (in json format)
To facilitate the connection configuration of the cloud plugs, it is possible to import and export the configuration data in json file format. This means that this does not have to be done manually, which makes it easier to use, especially if there are a large number. The buttons can be found in the Cloudplug configuration under Connections right next to the buttons for Delete and Edit.
The following rules apply:
- When importing, the configuration type must fit
- The active status of the signals is preserved
- Unknown signals are removed
- Regular expressions are also imported and exported
- Duplicates during import are recognized and saving is not possible
Edit data → Import into portal → Save
Note: Only after saving the configuration will be adjusted in BigQuery!
BigTable streaming (optional):
With the BigTable Streaming function, the incoming data can be written to BigTable and BigQuery simultaneously. The advantage of the data in BigTable is the direct applicability of standard data analysis tools like 'Hadoop' or 'Spark'. The naming of the table in BigTable is the same as in BigQuery, also the data storage is continuous as in BigQuery.
EAV tables (optional):
by default the signals are stored in a separate column of a BigQuery table. With the function EAV View creation enabled signals can be stored in an EAV table (entity-attributevalue), this EAV table allows that all signals are stored in one column. Beside the column with the signals the timestamp and the signal name are stored in an own column.
To activate the EAV table function, set the check mark EAV View creation enabled for the corresponding table and save the configuration. The EAV tables are displayed in BigQuery in the Google Cloud Console, just like the previous BigQuery tables. The EAV tables get as name prefix: "EAV_[connectionName]_[deviceName]."
This feature does not exist for Cloudplug Light and Generic type gateways as they do not have individual configuration for connections. Another limitation is the number of columns, no more than 110 columns can be created for one EAV table. If a connection is deleted, the EAV tables remain as well as the BigQuery tables. The EAV tables feature can be enabled on request.
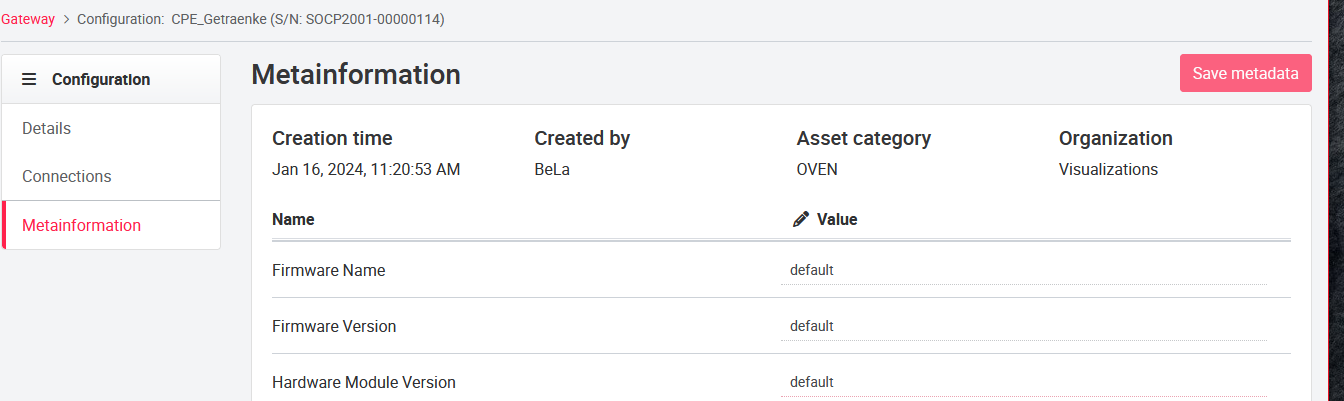
07.5.2 Metainformation (optional)
If the Metainformation tab has been enabled by an administrator, you can see various metainformation of the gateway on this page. The information can be created and edited through the API or the user interface. To make metadata usable by the user, see Portal_specific_entry_fields_for_assets_and_gateways
07.5.3 Cloudplug Light Configuration
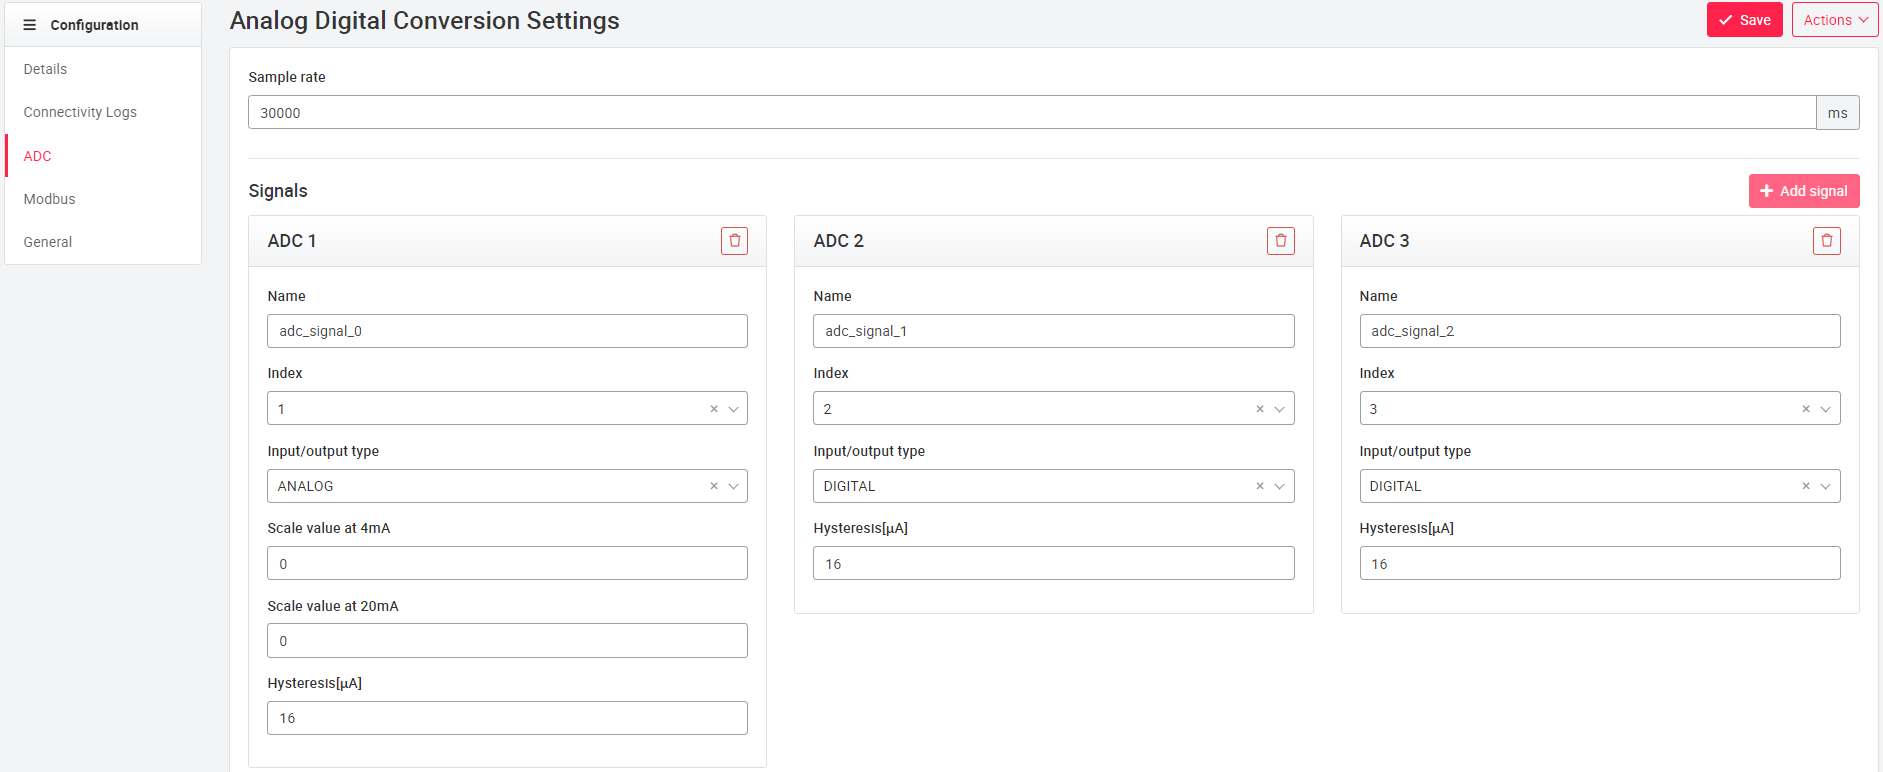
In ADC (analog-to-digital-converter) settings for analog-to-digital conversion can be made. The sampling rate can be set via the input field Sampling rate, the possible value range is between 100 ms and 60,000 ms, which corresponds to values between 0.1 s and 60 s. The sampling rate is the frequency with which a connected signal is sampled or measured and converted into a digital signal.
Via the plus button Add Signal ![]() a new input signal can be added. The signals are numbered consecutively with "ADC+Runnumber", an own signal name can be added under Name. The index number corresponds to the terminal number on the cloud plug.
a new input signal can be added. The signals are numbered consecutively with "ADC+Runnumber", an own signal name can be added under Name. The index number corresponds to the terminal number on the cloud plug.
Using Input/Output Type, the corresponding input signal of the terminal can be selected. A choice can be made between analog-to-digital and digital-to-digital conversion. When assigning the signals, it is important to ensure that only one analog signal is present at the cloud plug input when the input/output type is set to ANALOG. If a digital signal is applied to an input set for analog signals, the input of the Cloudplug will be damaged and in the worst case even completely destroyed! Analog signals can be sent to digitally configured inputs without that damage occurs. All inputs of the Cloudplug are configured to the input/output type Digital at delivery!
The scaling values at 4mA and 20mA describe the output signal that will be given at a given input value. At a possible signal difference of 16mA different scaled values can be output, which are freely adjustable. The hysteresis describes the value range of a single signal and can also be freely assigned.
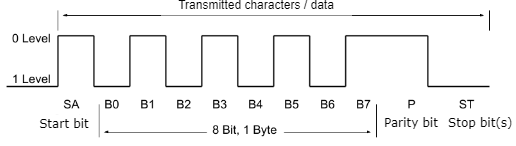
Under Modbus the settings of the MODBUS data acquisition (data acquisition) can be found. The basic setting is the bus configuration, here baud rate, parity, data bits, stop bits and the poll interval can be defined. The baud rate (also called symbol rate, baud = per second) specifies the transmitted characters per time unit. For example, a baud rate of 19200 corresponds to a transmission of 19200 characters per second. The parity is the check for complete data transmission. A closed group of bits is assigned an even or odd parity when the data is sent. If the number of bits changed during reception, there was an error during data transmission. The parity can be applied, but does not have to be (switch off by selecting None for parity). The data bits (bits) are the number of information units that are transmitted.
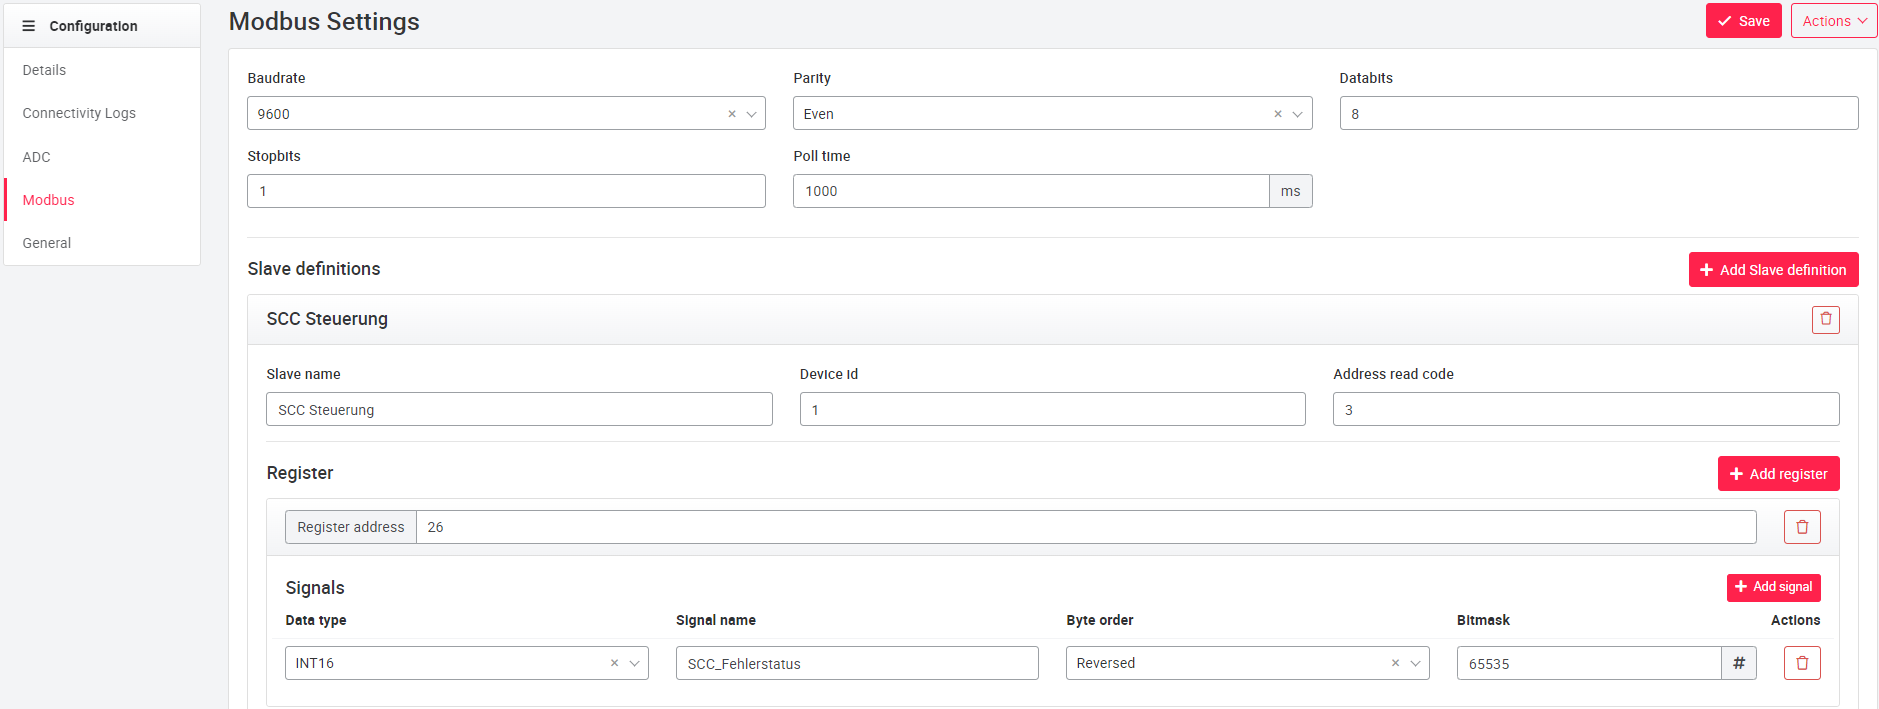
The stop bits indicate the end of a string of data bits and parity bit. It can consist of a single bit or a bit combination.
The poll interval specifies the time in which intervals the data input is polled for new data.
Under Modbus Slaves new Modbus Slaves can be added (plus icon ![]() right beside Modbus Slaves). The basic setting consists of Modbus Slave Name, Device ID and Read Code. If no own name is assigned for the Modbus slave, it is automatically named with Slave and a consecutive number. The Read Code indicates from which register type the data is read.
right beside Modbus Slaves). The basic setting consists of Modbus Slave Name, Device ID and Read Code. If no own name is assigned for the Modbus slave, it is automatically named with Slave and a consecutive number. The Read Code indicates from which register type the data is read.
For each Modbus slave, registers can be added via the plus symbol ![]() at Add register. The registers are automatically numbered consecutively (can be changed manually using the buttons). Via the plus icon
at Add register. The registers are automatically numbered consecutively (can be changed manually using the buttons). Via the plus icon ![]() on the register a signal can be added, with the setting options: Data type, signal name, byte order, bit mask.
on the register a signal can be added, with the setting options: Data type, signal name, byte order, bit mask.
The data type corresponds to the data type to be read. The byte order describes the order in which the data is read from the register: raw-data means that the data is read from the first bit in the direction of the last bit. The order high-low word swap means, the second byte is read first and then the first. Reverse order reads the data from the last bit to the first bit. The bit mask depends on the data type and describes which bits are read from the register.
Value ranges of the setting options of bus configuration and Modbus slaves are in the table below.
Via the delete symbol ![]() below the add register option the whole register can be deleted. Via the delete symbol
below the add register option the whole register can be deleted. Via the delete symbol ![]() below the add signal option only the signal of the register can be deleted.
below the add signal option only the signal of the register can be deleted.
After editing the Modbus settings, the changes must be saved via the Save button above. This will save the configuration to the portal. To transfer a configuration to a cloud plug, the Transfer configuration to IoT Core button must be used (top right of the Save button).
| Setting options | Value range / setting variables |
|---|---|
| Baudrate | 1200, 2400, 4800, 9600, 19200, 38400, 57600, 115200 |
| Parity | None, Even, Odd |
| data bits | 5, 6, 7, 8, 9 |
| stop bits | 0, 1, 2, 3 |
| Poll Interval | 990 - inf. |
| Read Code | 3, 4, 5, 6 |
| Data Type | INT16, UNIT16, INT32, UNIT32, FLOAT |
| Byte Order | Raw Data, High/low Word Swap, Reverse Order |
| Bitmask | Depending on data type |
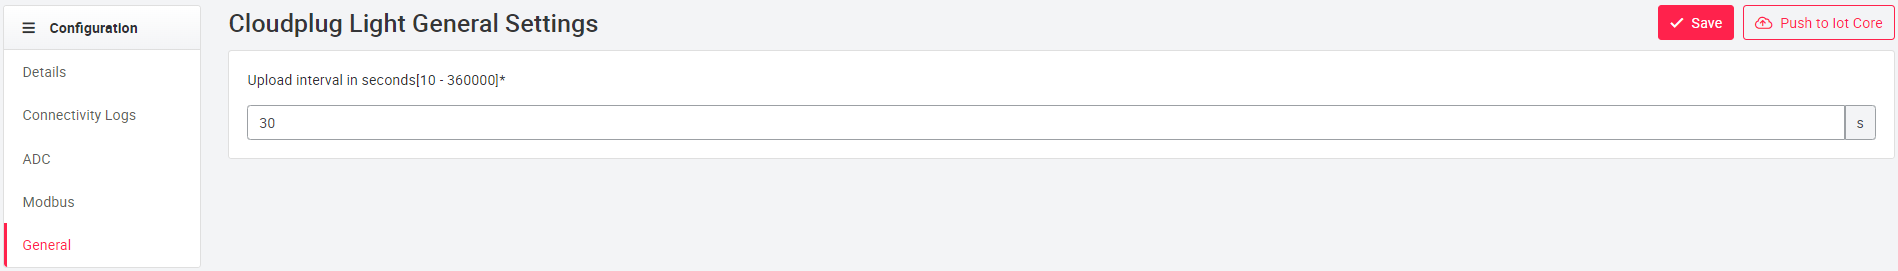
In the General section the upload interval in seconds can be specified. The interval is the frequency with which the cloud plug loads the data into the cloud and has a value range from 10 to 360,000 seconds.
7.5.4 Argos_Gateway
Gateway Status
On the gateway administration page, the status of the Argos_Gateway is divided into the following three groups:
- (red) - device is offline
- (orange) - The device is online, but no data has been sent in the last 720 minutes.
- (green) - The device is online and has sent data in the last 720 minutes.
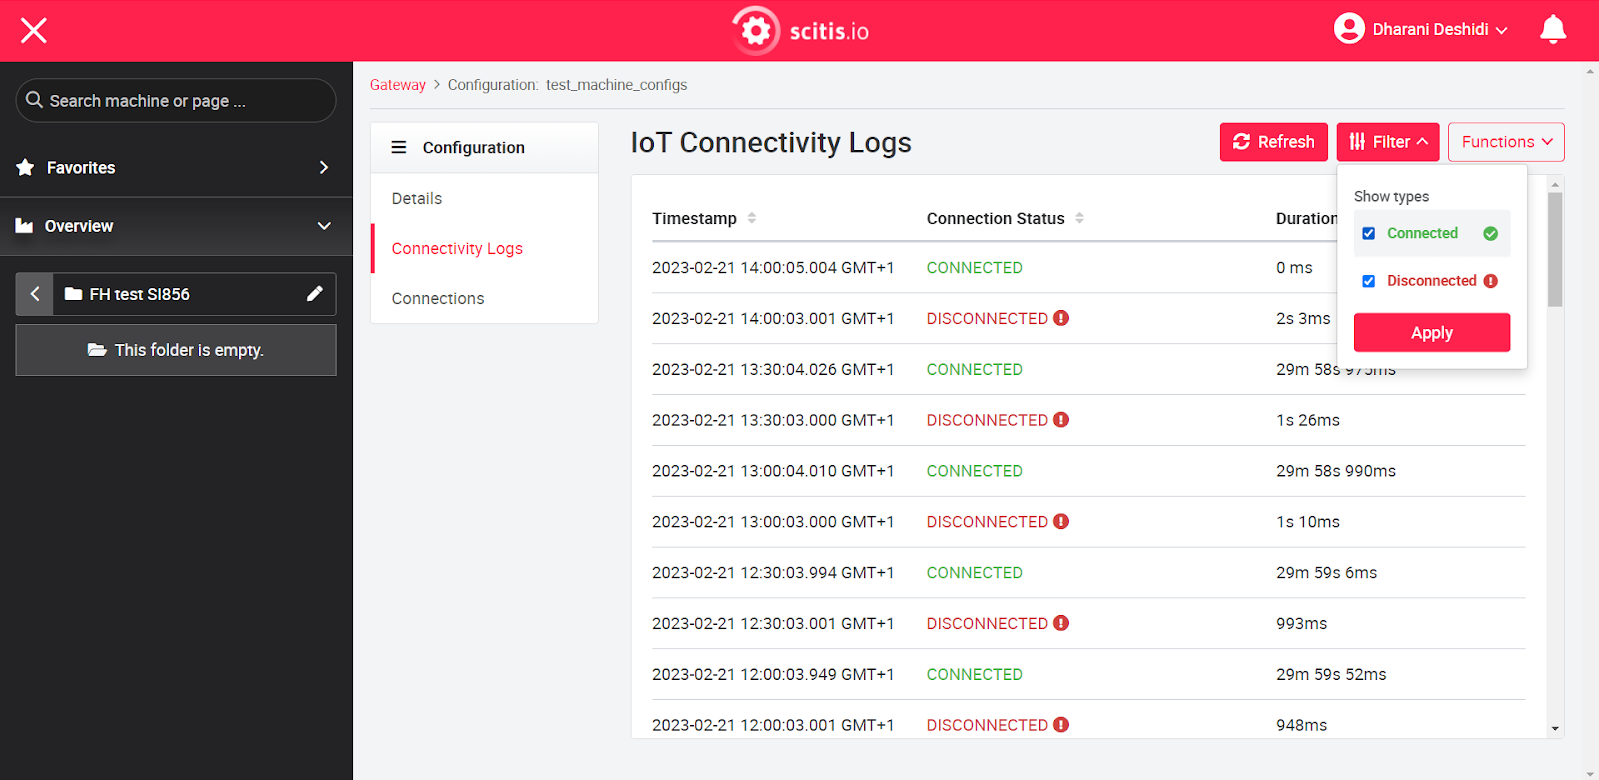
Logs
Under Logs, the user is enabled to view the current and historical connection status of argos.gateways within the portal without going into the GCP environment. Once the user navigates to this page, they will see the last 50 IoT Core connection logs. The "Refresh" button will update and display the latest IoT Core logs for that gateway from the cloud logging. The logs include the timestamp, connection status (connected/disconnected), duration of the current status, and reason for disconnection.
With the portal users can filter the gateway connectivity logs of IoT devices to see only the connect/ disconnect logs. A filter is available on the top of the connectivity logs page, from which user can either select disconnect or connect status. The connectivity logs are displayed in timestamp descending order (latest to oldest). A maximum of 50 logs are shown on the page.
07.6 Asset categories
The asset category administration page allows you to add new categories and edit the existing categories. The overview page lists all the current asset categories, shows their icon and a few details.
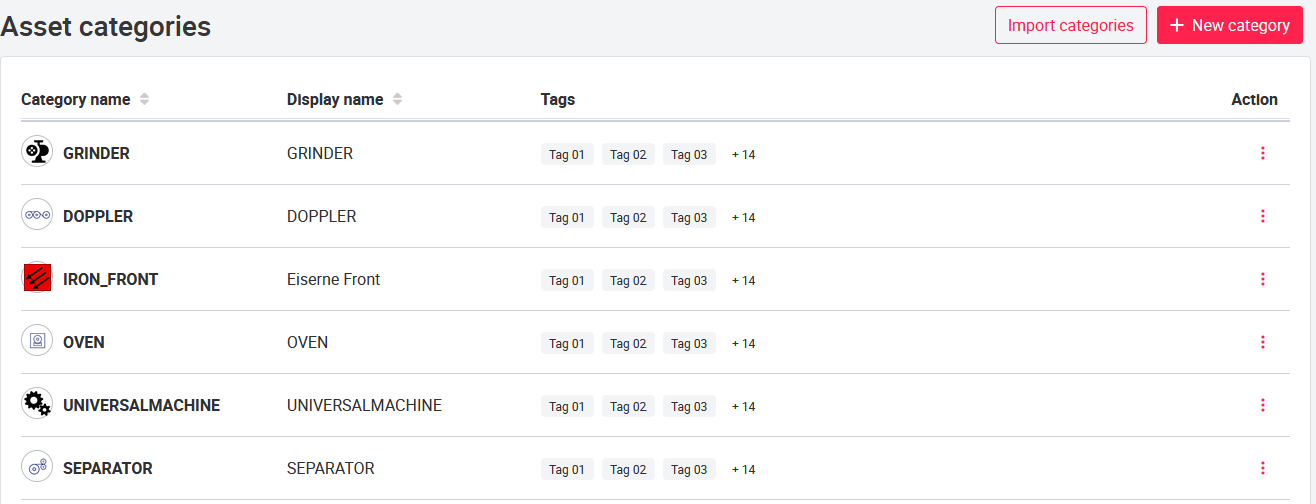
Clicking on the '+New category' button opens a modal to add a new category. The same modal is opened, when the three dots on the right side are clicked and the 'Edit' functions is selected.
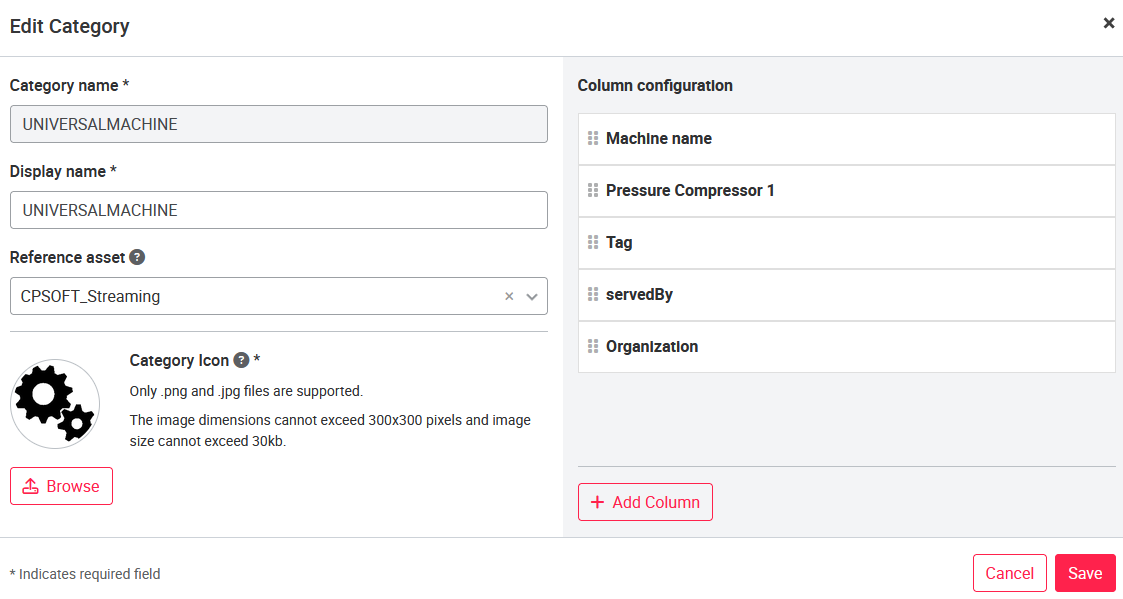
The columnn configuration allows to select the columns shown on the list view of the dashboard. It is possible to show some default data (like asset name, Gateway connectivity, organization, tag and traffic light status), metadata (see above) and a signal. If a signal is selected, it will always show the current value. However, it requires, that an asset with this category was created first, then the gateway configured and signals added in the assets's data configuration (see 04_Quick_Start_Guide). This asset can then be selected as the reference asset which will allow to select the signal.